Website KPIs: How to Track and Improve Your Site’s Performance
Every business owner wants their website to “work”. But… what does that even mean?
Some say it’s all about traffic.
Others insist it’s conversions.
And some companies just want their web page to look professional.
But no matter what your definition of a working website is, ultimately, it all comes down to tracking website KPIs
KPIs are like the scoreboard for your website.
They tell you what’s really happening behind the scenes. You learn whether visitors:
- Find your page dull and leave.
- Stay longer on your site.
- Actually do what you hoped they’d do: buy, book, sign up, and a million other things.
Without these metrics, you’re driving with your eyes closed: the car might still move, but you won’t know where you’re heading.
So, what do you need to track and actually improve your website performance?
Read on to learn our best tips!
Contents
Does every business need to track website metrics?
The right answer should be “yes”. It feels that way, right?
But surprisingly, the answer is “no”.
Do you know those websites that are nothing more than a static brochure? A page that companies send directly to their clients without much concern about search engine rankings, organic traffic, or conversion rates. Well, those websites don’t really need to track much.
All they need to do is simply provide information. And you don’t need web analytics for that.
But how many companies do you know that operate this way?
Just a few, right? Or maybe even… none?
Exactly.
Of course, a small local restaurant that mainly gets clients through foot traffic and word-of-mouth doesn’t need any of these fancy KPIs. Their site just shows their menu, address, and phone number. As long as the info is up to date, they’re fine. Some might not need a website at all.

Source: Pure Thai Cookhouse
And a government agency with an info portal needs availability more than conversion rates.

Source: GPO
And yet, most businesses rely on their websites for good reasons. This is their main channel that brings in new customers, generates leads, and even reduces customer acquisition costs.
So, unless you’re one of those rare “digital brochure” companies … tracking KPIs is essential. How is it essential?
Well, tracking KPIs helps companies:
- Understand user behavior and how website visitors move through their user journey.
- Spot problems (slow page load time or poor site speed) before they chase people away.
- Measure the effectiveness of SEO strategies, marketing initiatives, and landing pages.
- Align their business goals with real data.
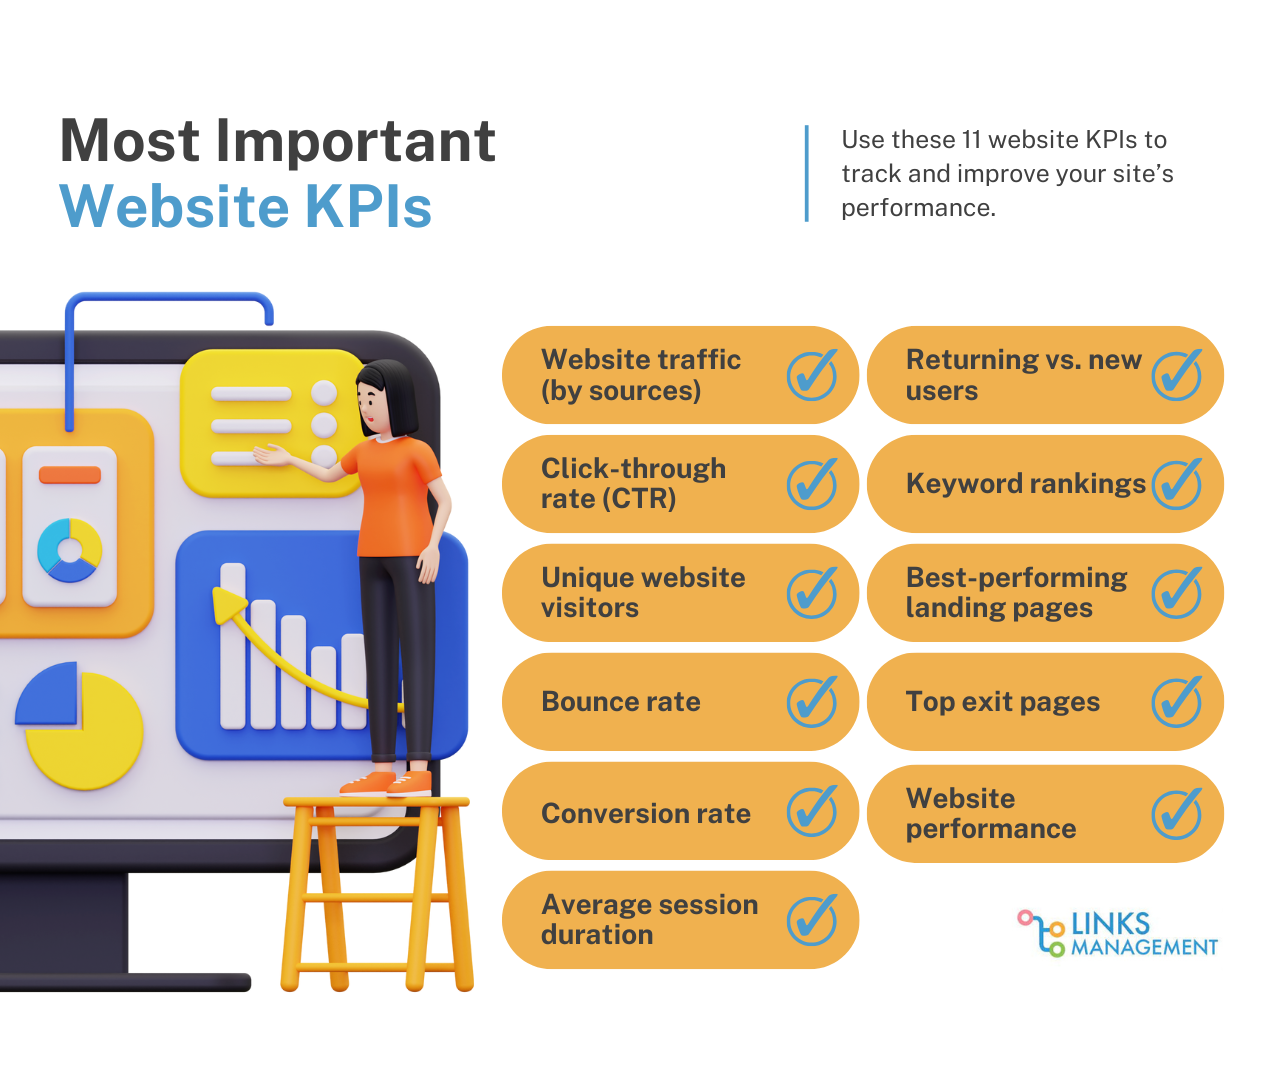
11 most important key performance indicators you have to know
Every website tells a story. Some stories are about growth, some about struggle, some about missed opportunities.
Key performance indicators are the closest thing to the truth a business can get online. They cut through assumptions and gut feelings to show you how people behave in real situations related to your business:
- Are your visitors just passing through, or are they staying?
- Do they explore multiple pages, or vanish after checking just one?
- Are your marketing initiatives creating meaningful engagement, or just draining your budget?
Choosing the right website KPIs to track has a lot to do with your business objectives. Because the reality is: you can measure almost anything. The real challenge is deciding what matters.
Let’s take a look at the most important website metrics and how they work.
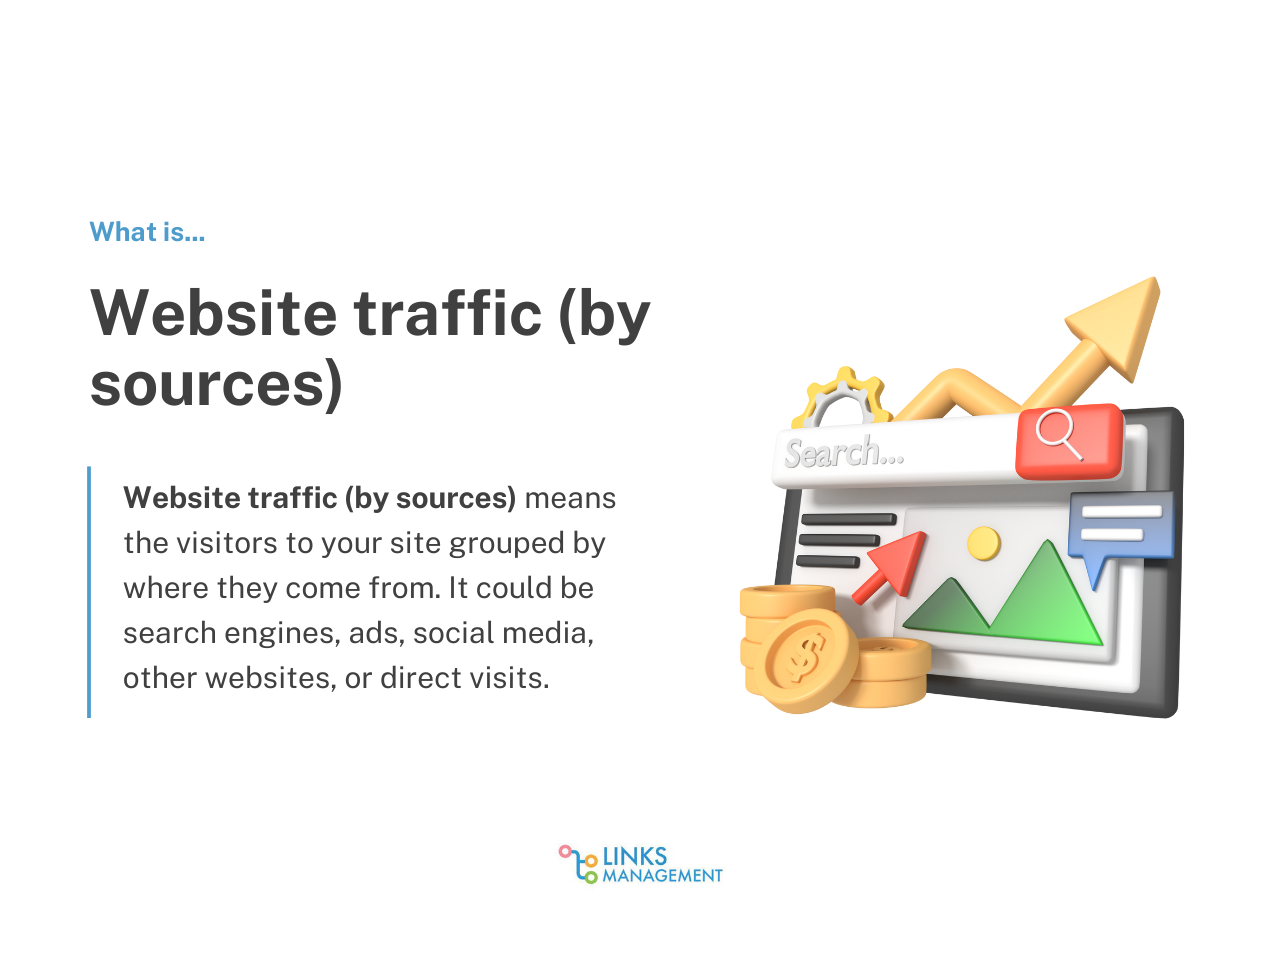
#1 Website traffic by sources
Website traffic (by sources) tells you two things at once:
- How many unique visitors your site attracts,
- And where those visitors are coming from. It can be organic search traffic, referral traffic, social media traffic, paid traffic (from Google Ads, for example), etc.
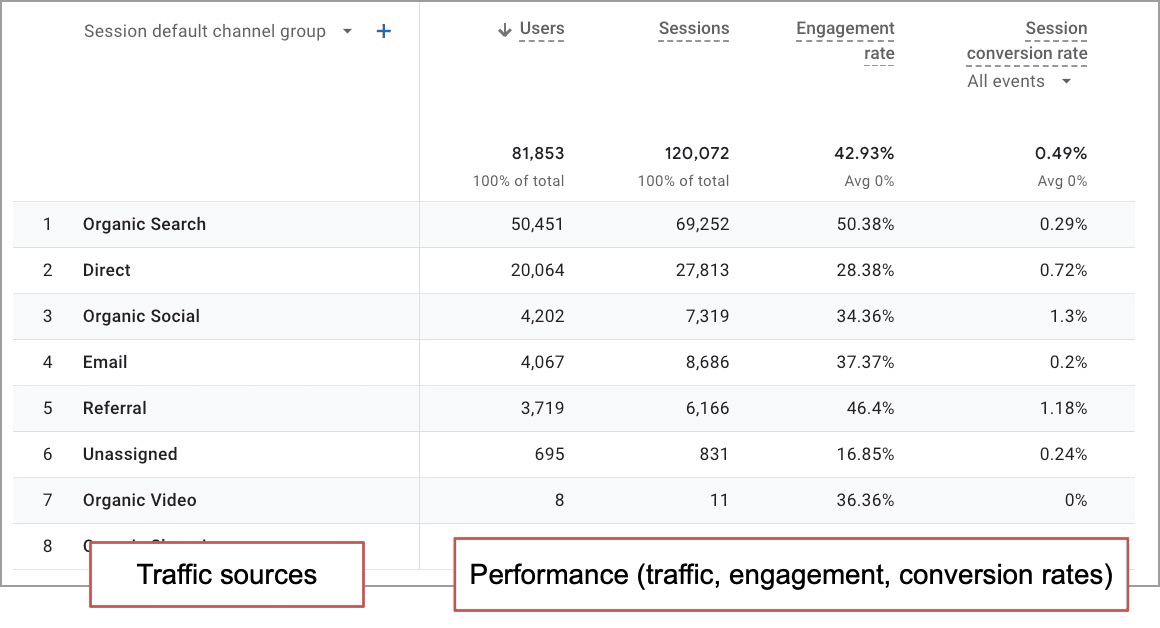
For example, let’s say your site gets 10,000 visits a month. If 70% comes from organic traffic, it means your SEO strategies are working. If most of your traffic comes from paid ads, you might rely too heavily on paid channels, which could lead to higher customer acquisition costs.
But why does it even matter? The answer is rather simple.
Knowing your traffic sources helps you see which marketing campaigns drive the best results, and where to invest more.
Tracking traffic sources also shows how different groups of users interact with your site. For example, people who come from referral traffic might behave differently from social media traffic. One might read multiple pages, while the other could bounce quickly.
Besides, watching how sources shift over time helps you track your progress:
- Did a new content marketing campaign improve organic reach?
- Did influencer marketing suddenly spike referral visits?
- Did your new viral post flood your website with new leads?
Source: Orbit Media
How to improve:
Here are some things you can do to work on your website traffic from different sources:
- Test multiple headlines and calls to action (A/B testing) for more organic traffic.
- Match your copy to user intent (don’t promise one thing on socials and deliver another on your website).
- Add emotional or urgency triggers (e.g., “today only,” “free trial”).
- Refine audience targeting so your content reaches the right people.
- Try referral marketing to get more referral traffic.
- Create valuable tools, widgets, calculators, or dashboards that users come back to.
- Use offline campaigns (events, podcasts, print) to push direct visits.
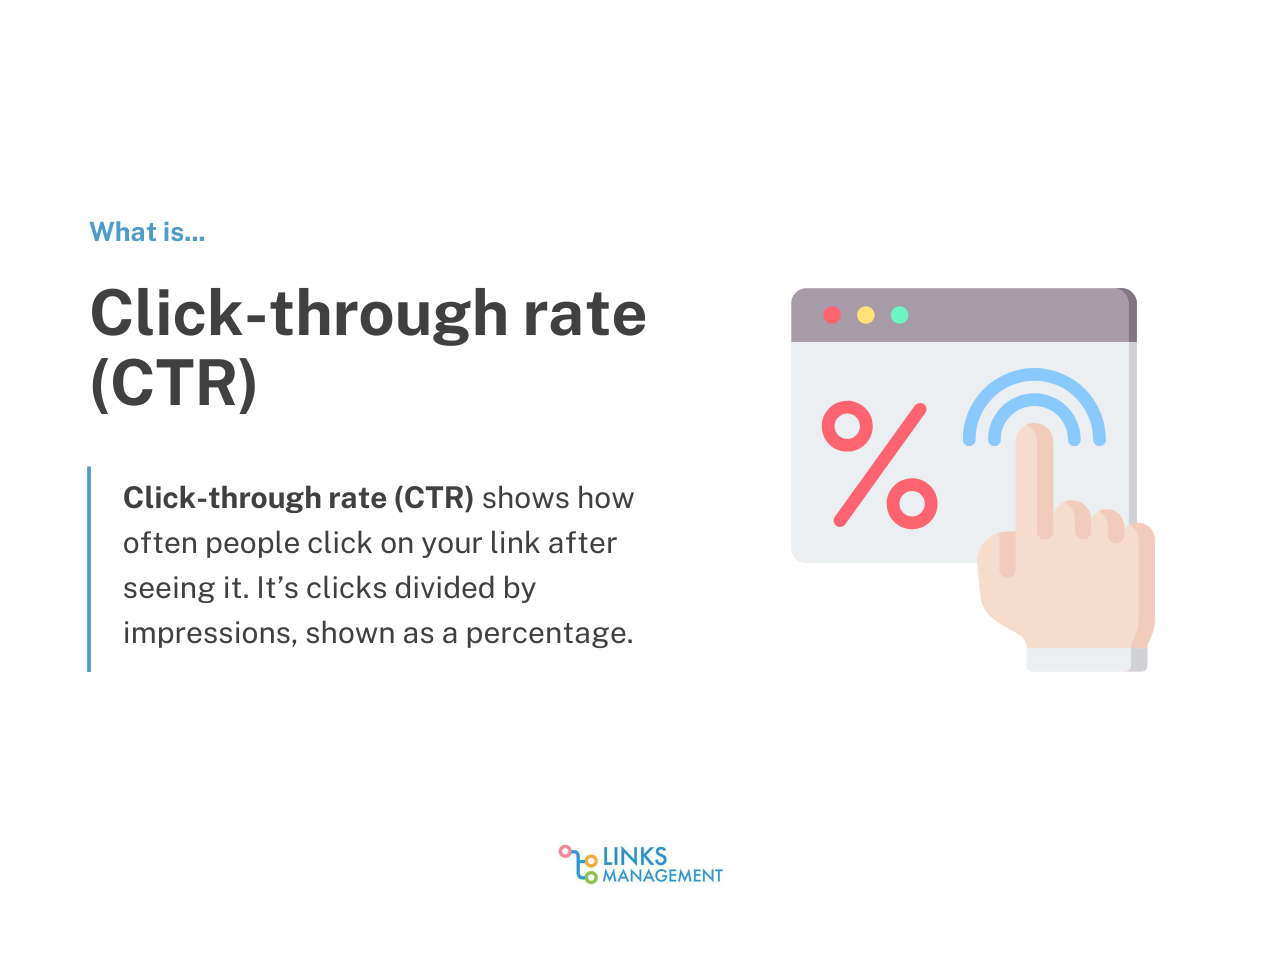
#2 Click-through rate (CTR)
The click-through rate is one of the most misunderstood yet talked-about KPIs. On paper, CTR is simple: it tells you the percentage of people who saw a link, button, or ad and actually clicked on it.
But what actually happens in practice?
It’s like checking if the menu photos at a restaurant actually make people order the dish. Of course, nobody “clicks” on the sad-looking salad, but a giant cheesy burger gets instant attention:)
But there could be many less obvious reasons for CTR issues.
The formula, though, is simple:
CTR = (Clicks ÷ Impressions) × 100
Impressions = how many times people saw your link or ad.
Clicks = how many times people actually clicked.
For example, if 1,000 people see your ad and 50 click on it, your CTR is 5%. Sounds easy, right? But behind that little percentage lives a whole story about how relevant and compelling your content really is.
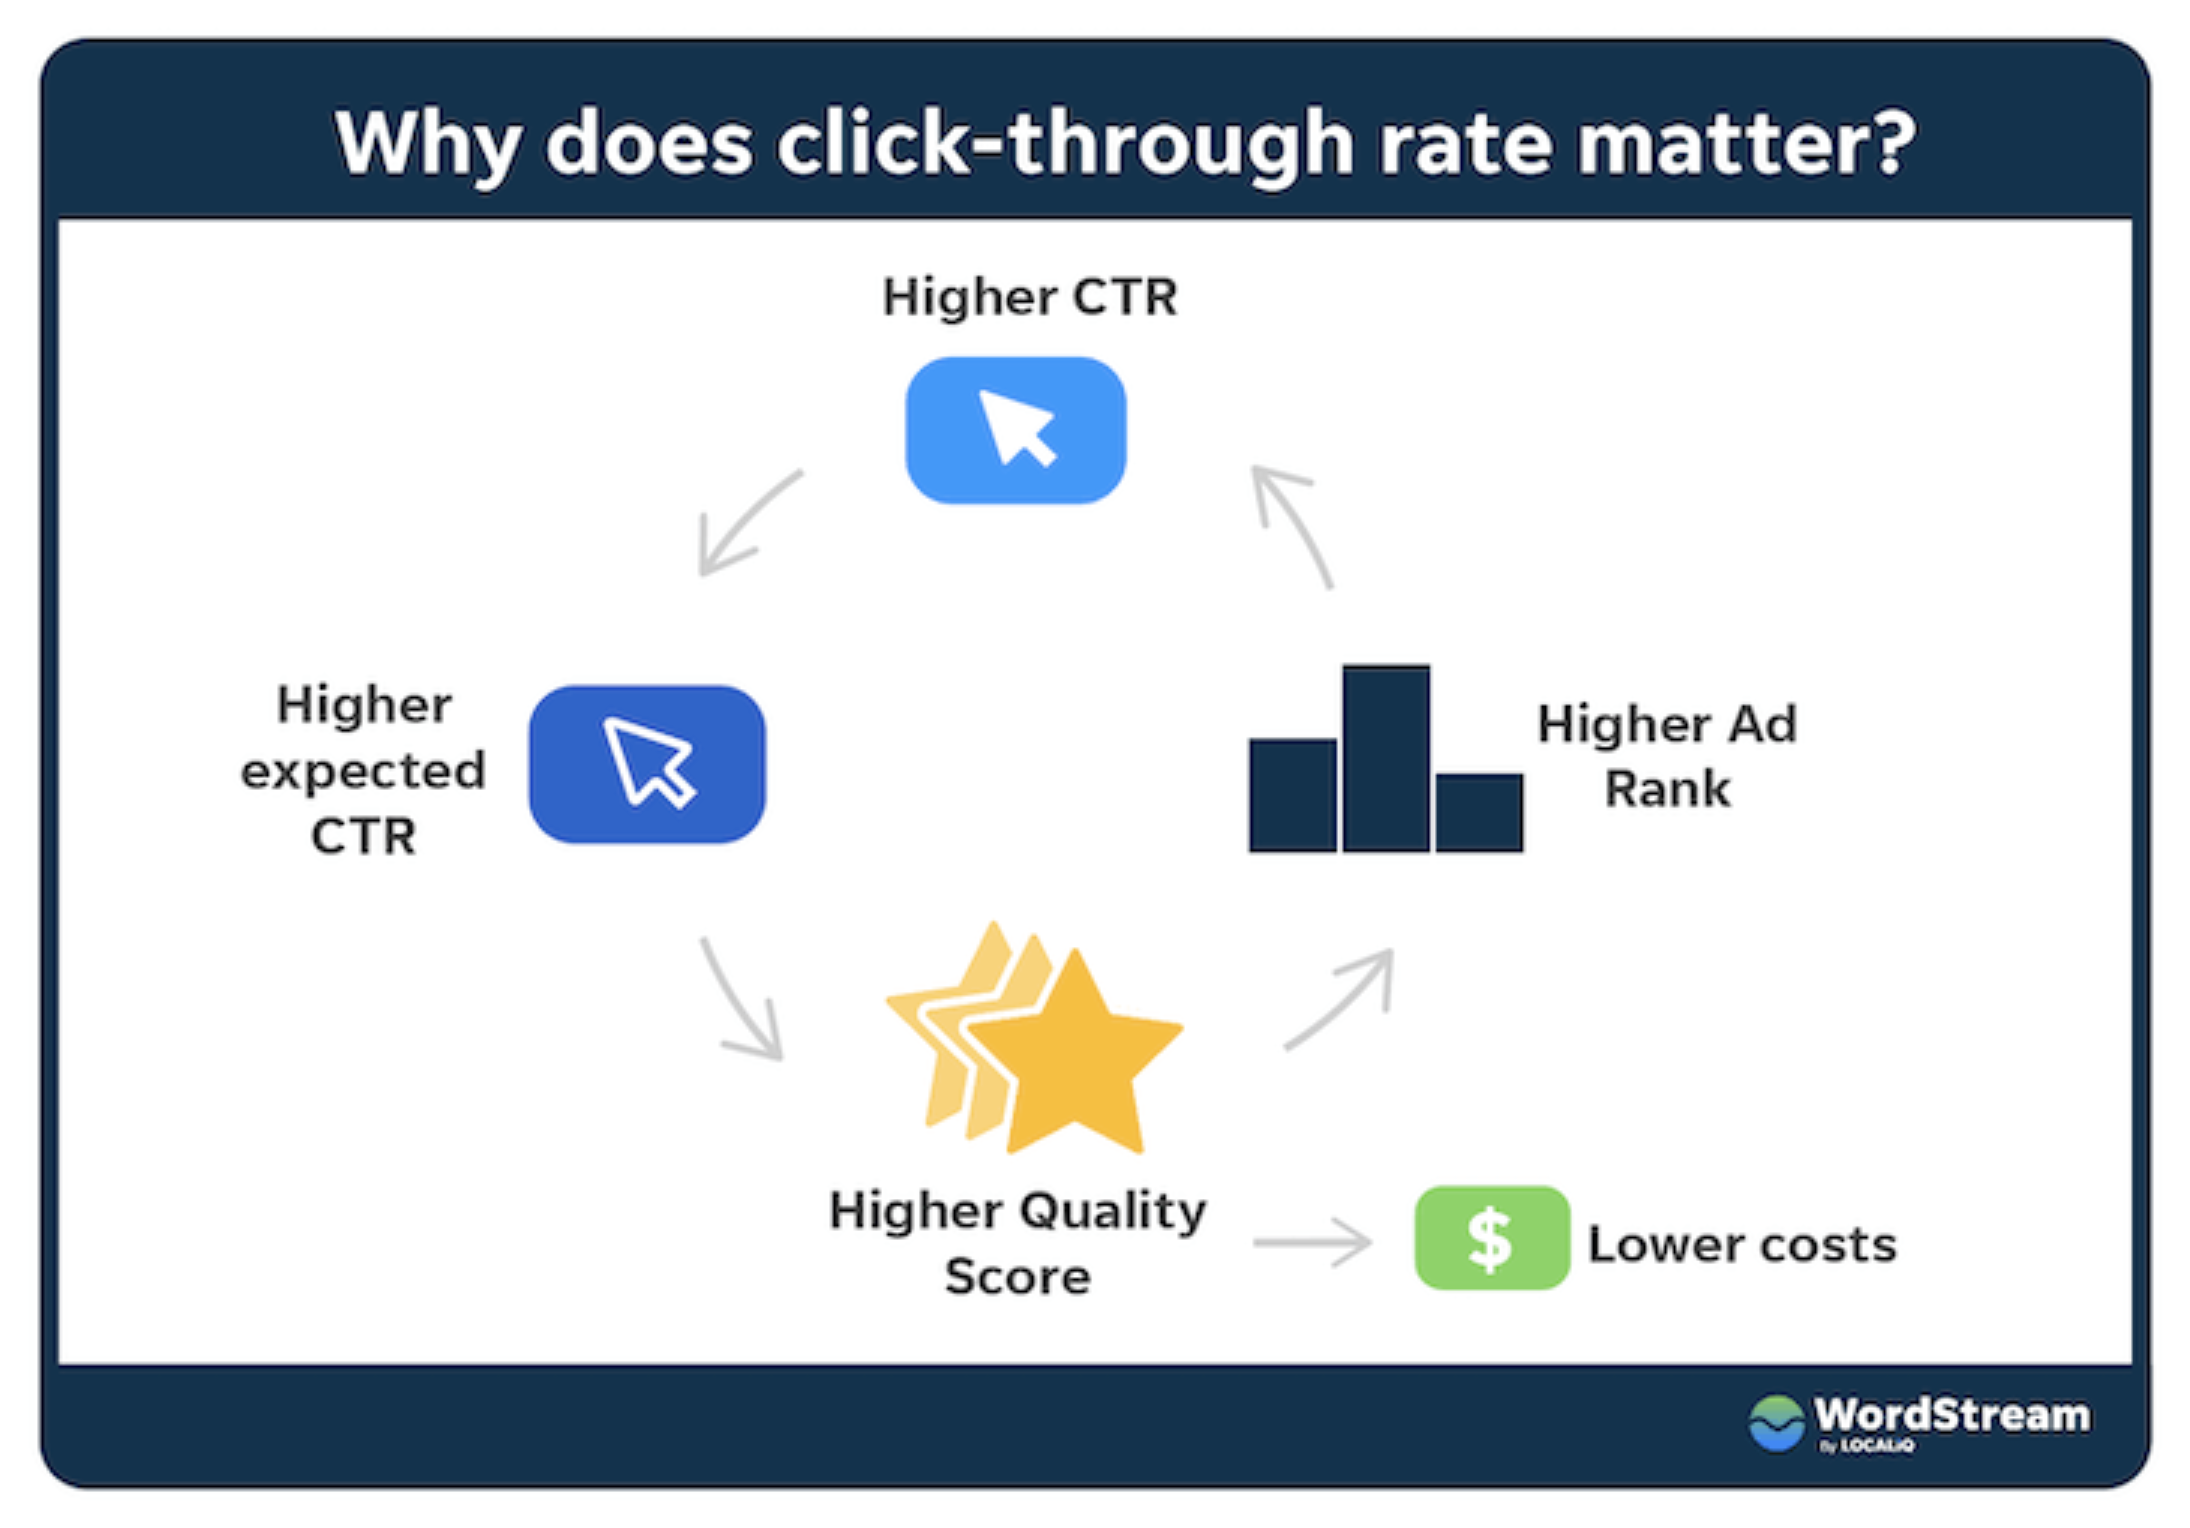
Source: WordStream
How to improve:
Improving CTR will take a lot of trial-and-error because you have to test and find what works:
- Headlines are the first thing users see in search engine results, ads, or emails. Make them specific, benefit-driven, and relevant to the search query.
- Even though meta descriptions don’t directly affect rankings, they strongly influence clicks. Summarize the page, highlight benefits, and use a call to action.
- If someone searches “best running shoes for flat feet,” your title and description should address exactly that. So, be precise here.
- Use schema markup for rich results that attract more attention to your page.
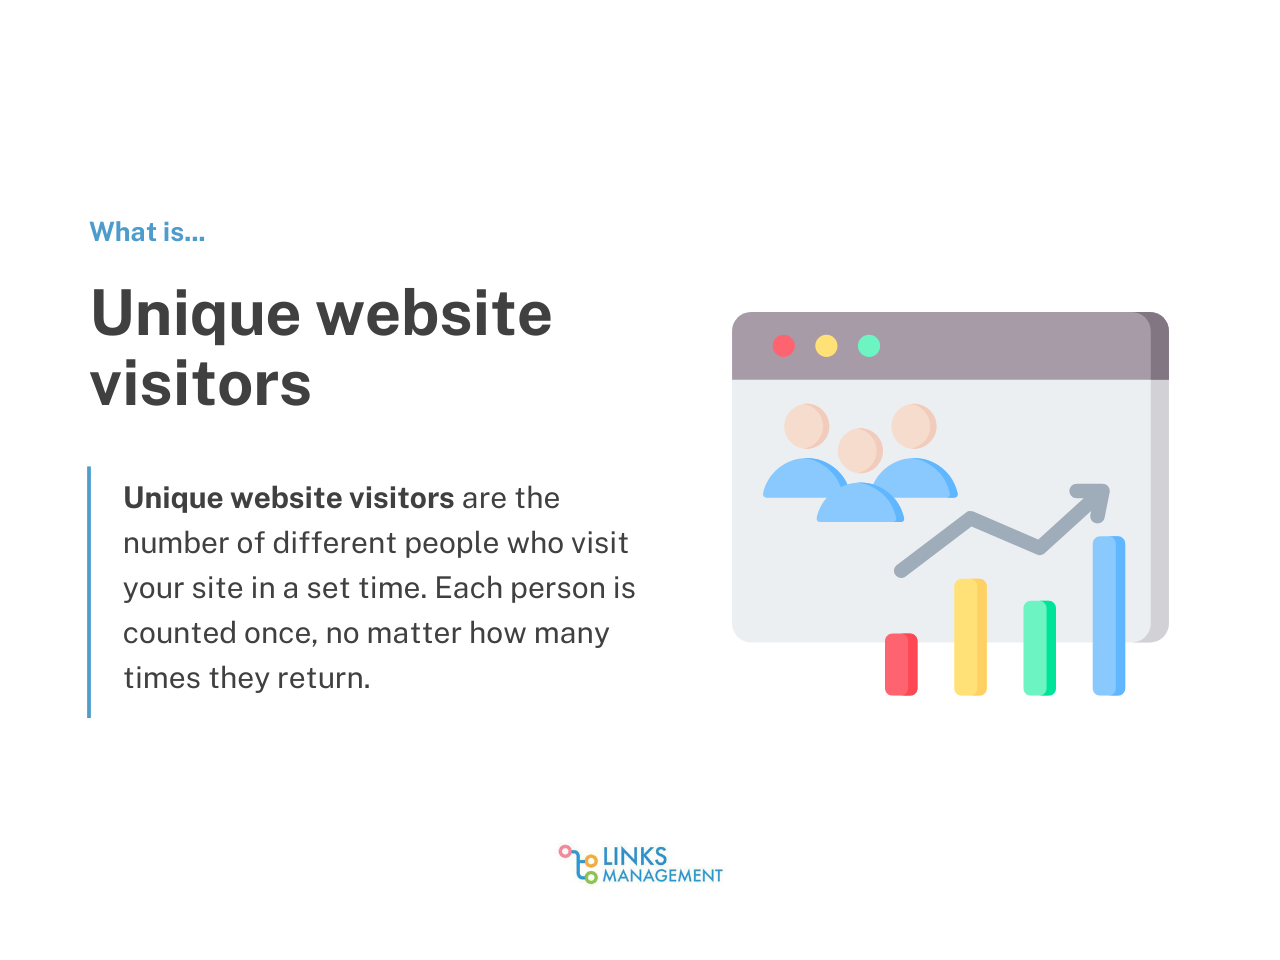
#3 Unique website visitors
Unique visitors are, in other words, the number of people who visit your website in a given period. Regardless of how many times they return. That’s why they are different from pageviews or sessions, by the way.
One person could visit five times, but they still count as a single unique visitor.
So, don’t confuse unique visitors with total visits/sessions. Total visits count every time the same people come back to your site, while unique visitors only count them once within a time period.
Suppose your analytics dashboard shows 50,000 visits in a month but only 15,000 unique visitors. This isn’t bad by any means. That shows that many of your website visits are repeat traffic, which is a sign of a loyal audience.
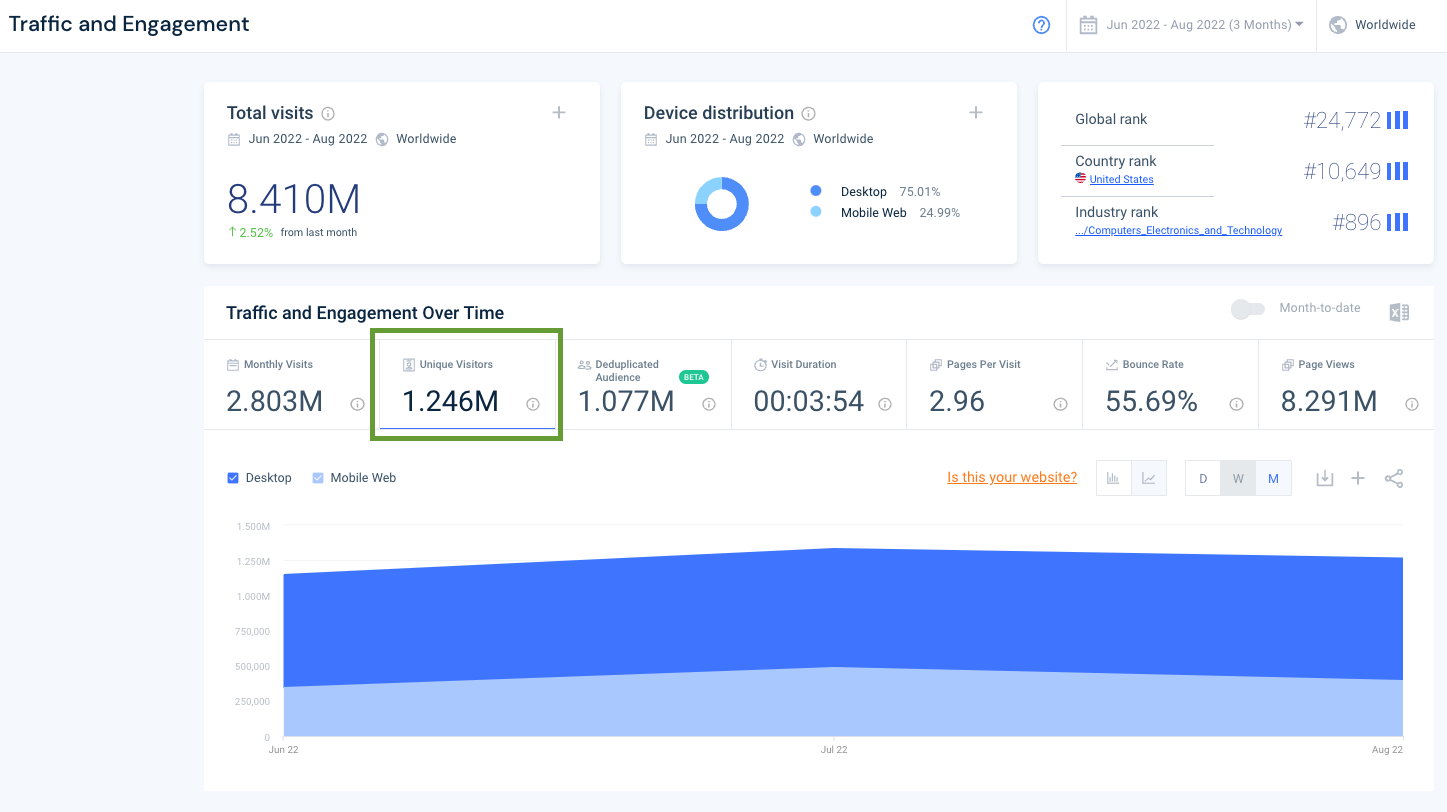
Source: SimilarWeb
But there is another side to this.
Depending on your goals, both numbers matter: unique visits show reach, while repeat ones show engagement.
Why is it important?
- Unique visitors tell you how well your brand is expanding its audience.
- But if unique visitors stay flat but total visits are high, you’re recycling the same users and… you’re not growing.
So, if your objective is to acquire new leads, you have to adjust your strategy.
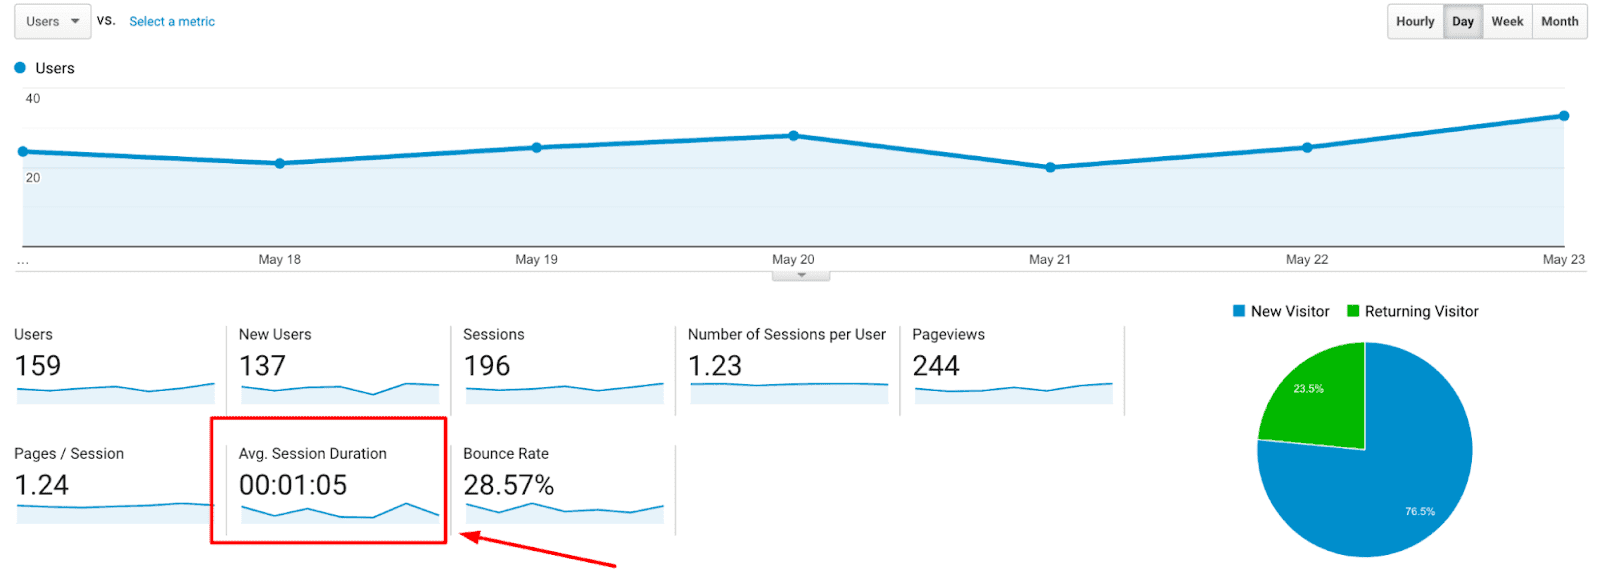
How can you measure it?
The easiest (and free) way is to use Google Analytics 4. Look under “Total users” (for unique visits) and “New users” (for first-time visits).
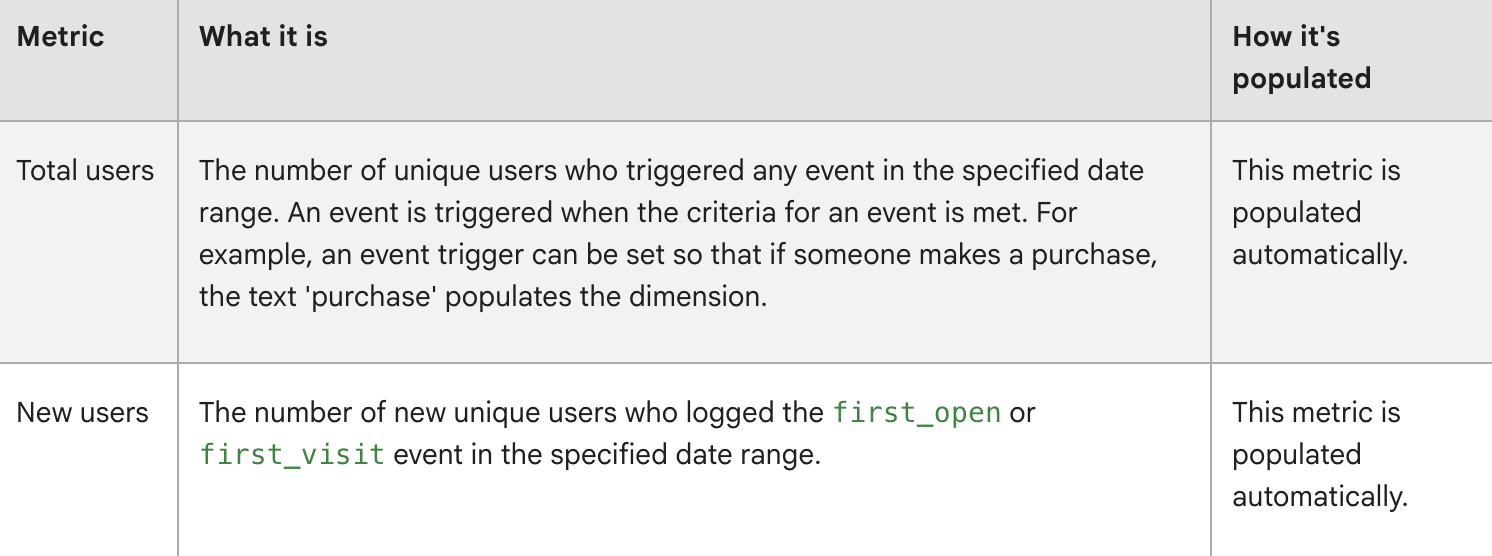
Source: Google
But you can also use any other paid analytics tools (Mixpanel, Adobe Analytics, etc.) to track this. Most of them rely on cookies or login IDs to distinguish individuals.
How to improve:
If you want to improve this one (probably, you do), here is something to take action on:
- Publish articles targeting new focus keywords to bring fresh audiences.
- Partner with other brands, newsletters, or industry communities to target new people and bring in new traffic.
- Experiment with formats and platforms to meet your prospects where they are.
- Run targeted campaigns designed to bring net-new users, rather than retargeting the same pool.
- Consider getting media mentions or writing guest articles, as they can introduce your brand to completely new segments.
#4 Bounce rate
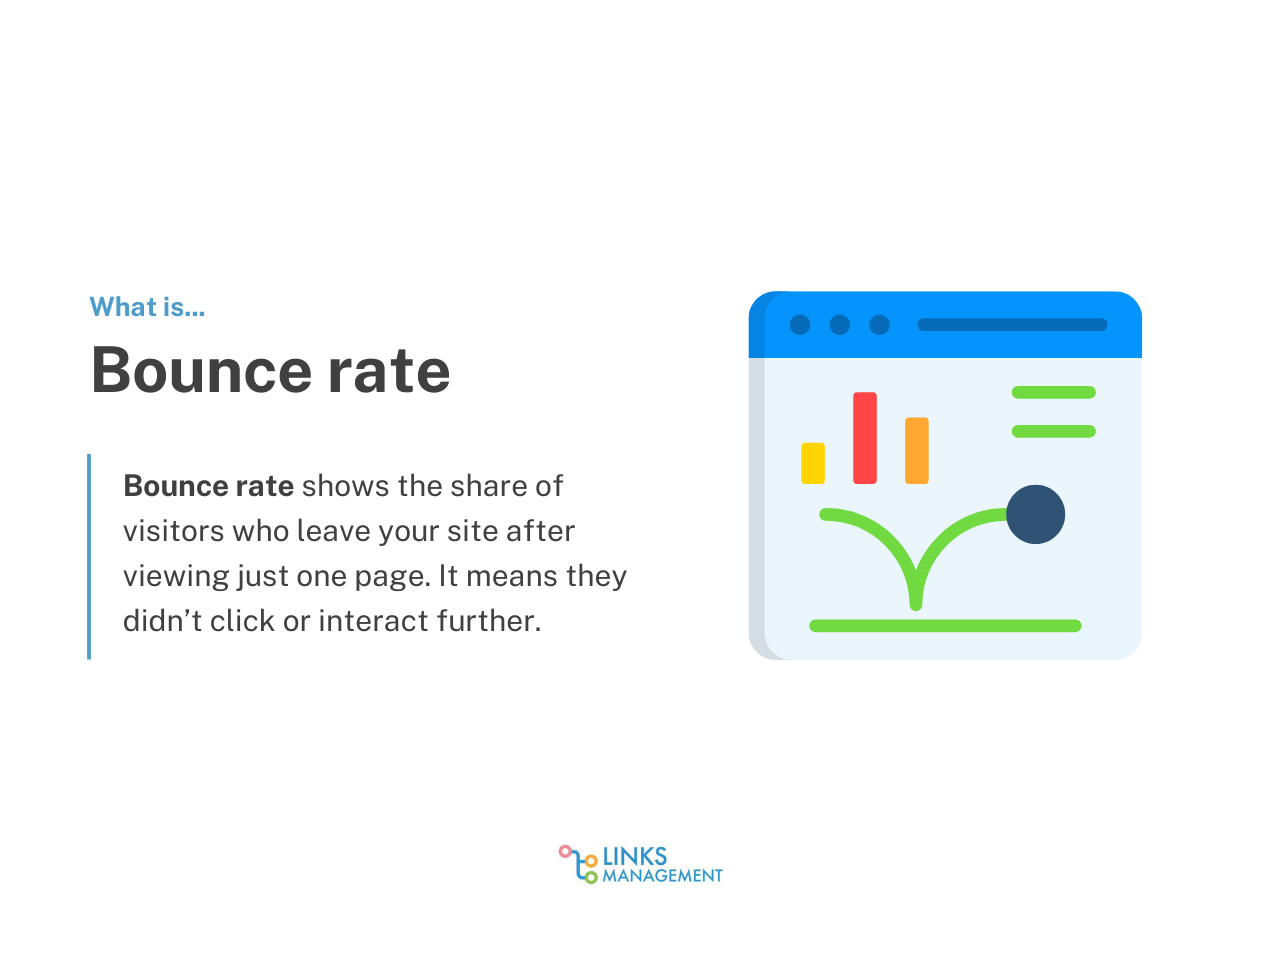
You know how some people just take a look at your page, don’t click anywhere, and simply close the tab? Well, that’s a sad metric called “bounce rate.”
But let’s take a look at a more tangible scene. Say, your blog attracts 5,000 visitors a month. If 3,000 leave after only reading the post they landed on, your bounce rate is 60%.
However, for a blog, this may be acceptable. But on a product page, that same number would be alarming.
Context means a lot here.
But why does it matter?
Bounce rate tells you if your page is delivering what users expect. If people search “best running shoes under $100” and land on a page with luxury sneakers for $500… expect a quick bounce. Fair, isn’t it?
A high bounce rate can signal that your marketing campaigns are attracting the wrong people.
For marketing teams managing clients’ websites, bounce rate is one of the key website KPIs to track progress. Yet, to see a bigger picture, try monitoring it together with other metrics. For example, average session duration and conversion rates can tell a fuller story.
Most analytics tools calculate it automatically. It’s the percentage of single-page sessions, visitors who left without interacting further. A good rule of thumb is to check it with your Google Analytics.
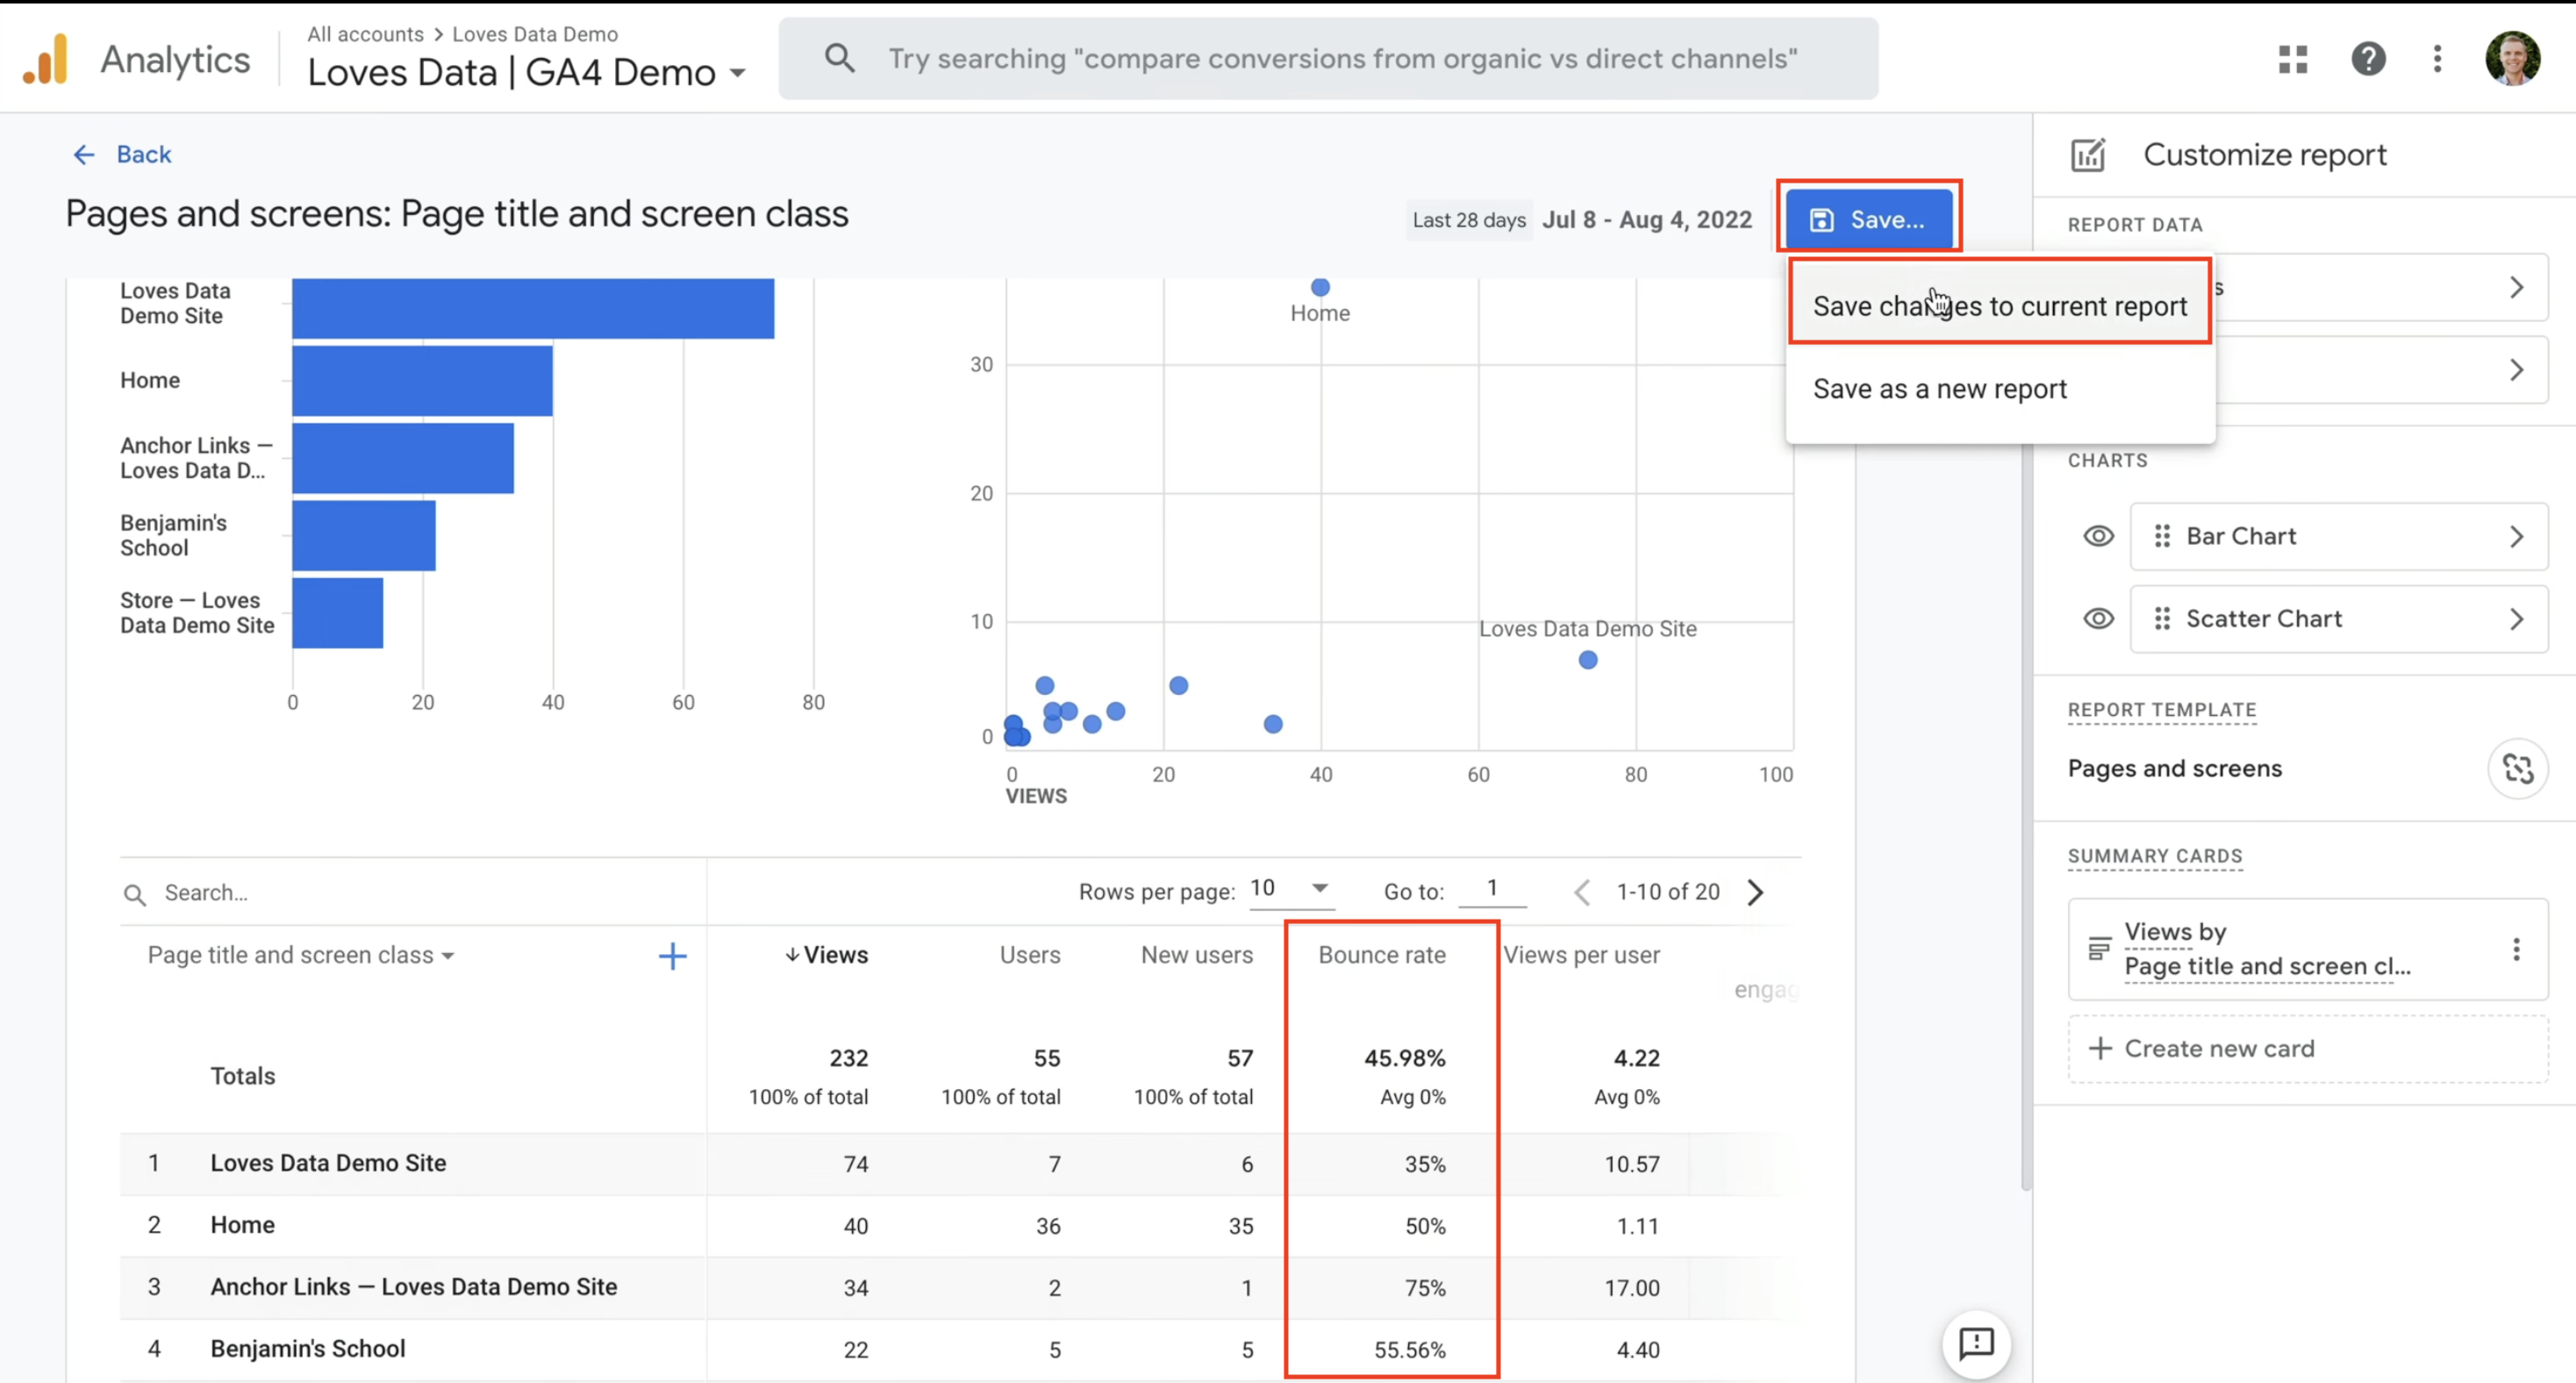
Source: Hotjar
The formula is also logical:
Bounce Rate = (Single-Page Sessions ÷ Total Sessions) × 100
What is the standard for a good bounce rate?
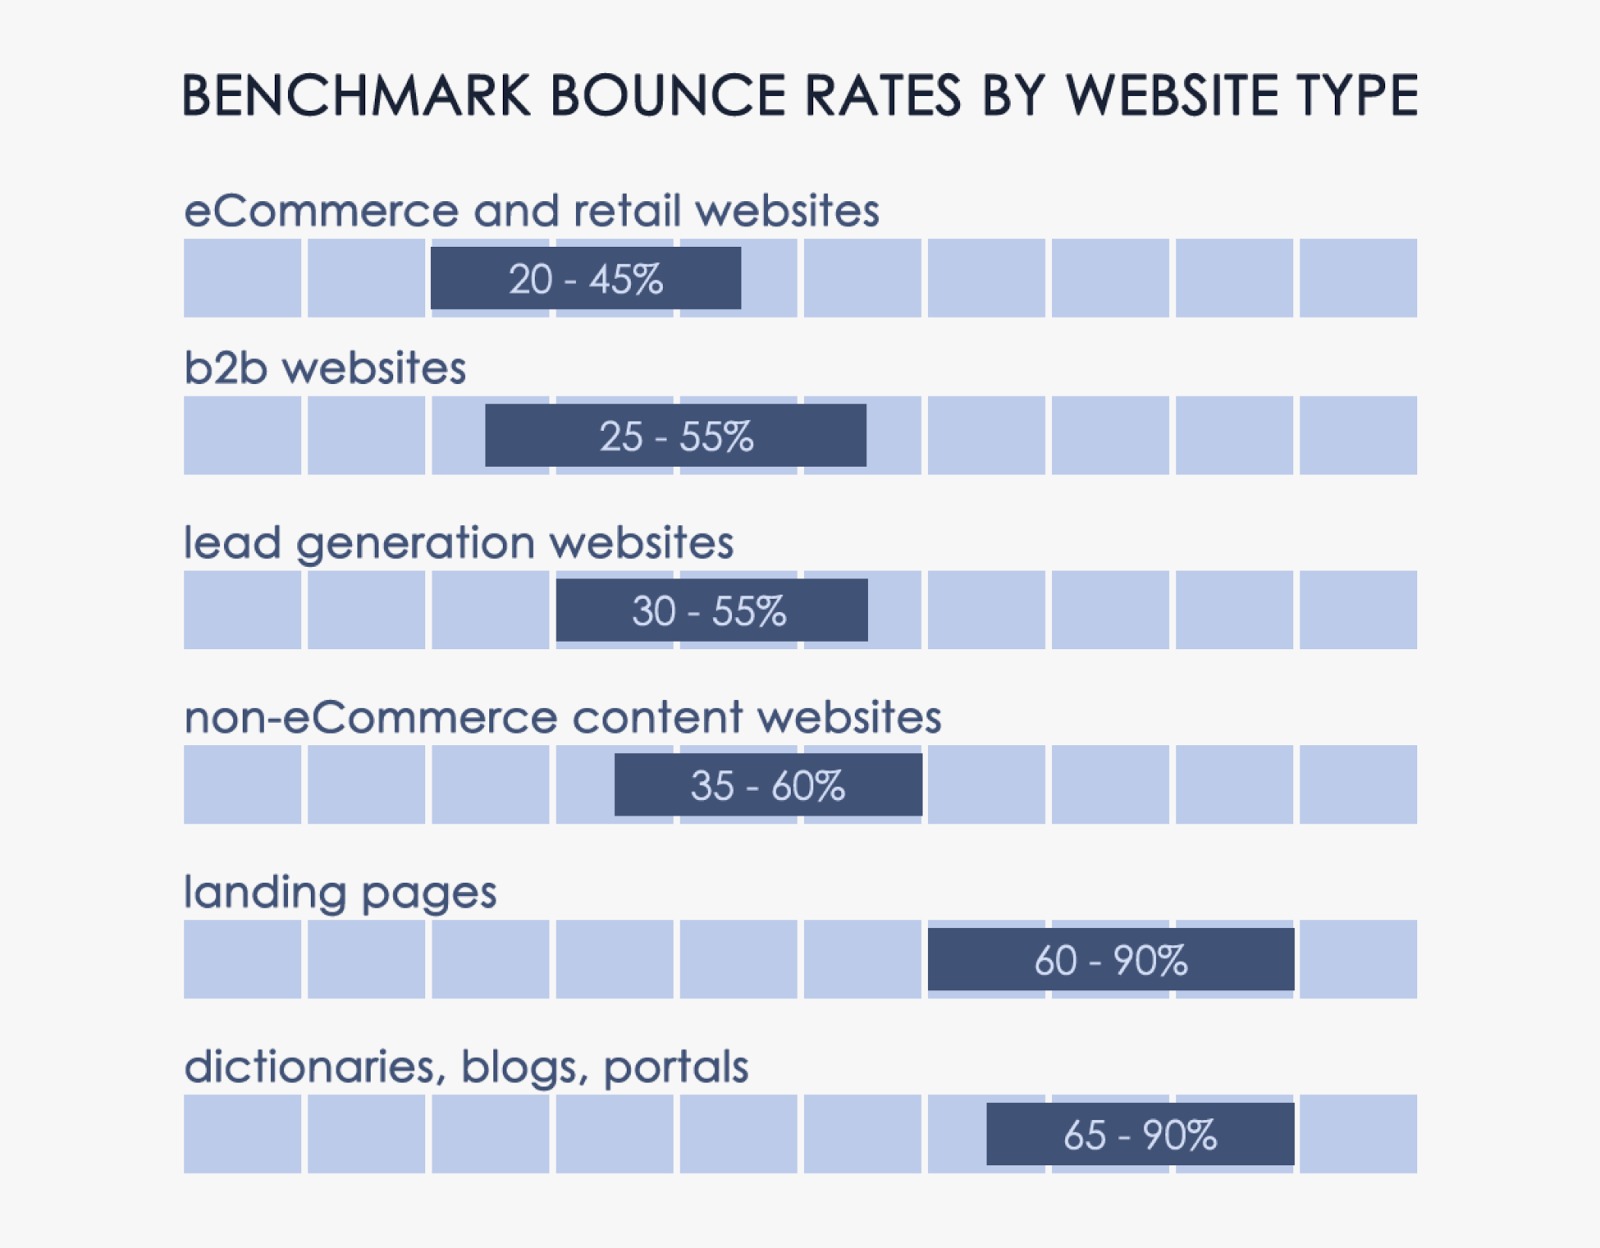
This will depend a lot on your format, goals, content, audience, traffic source, and tons of other variables. Still, these are some estimates you could use:
- Blogs and news sites: 60-90% can be normal. Many people read one article and leave, and that’s alright.
- E-commerce product pages: 30-40% is a decent rate you’d expect. It’s much lower, as the essence of online shopping is to get people to browse multiple pages.
- Landing pages with one CTA, no lead magnets, and no encouragement to explore something further: 60-90% can be fine. But you still want this page to convert. So, make sure you watch this one closely if your bounce rate is high and conversions are low.
Source: CXL
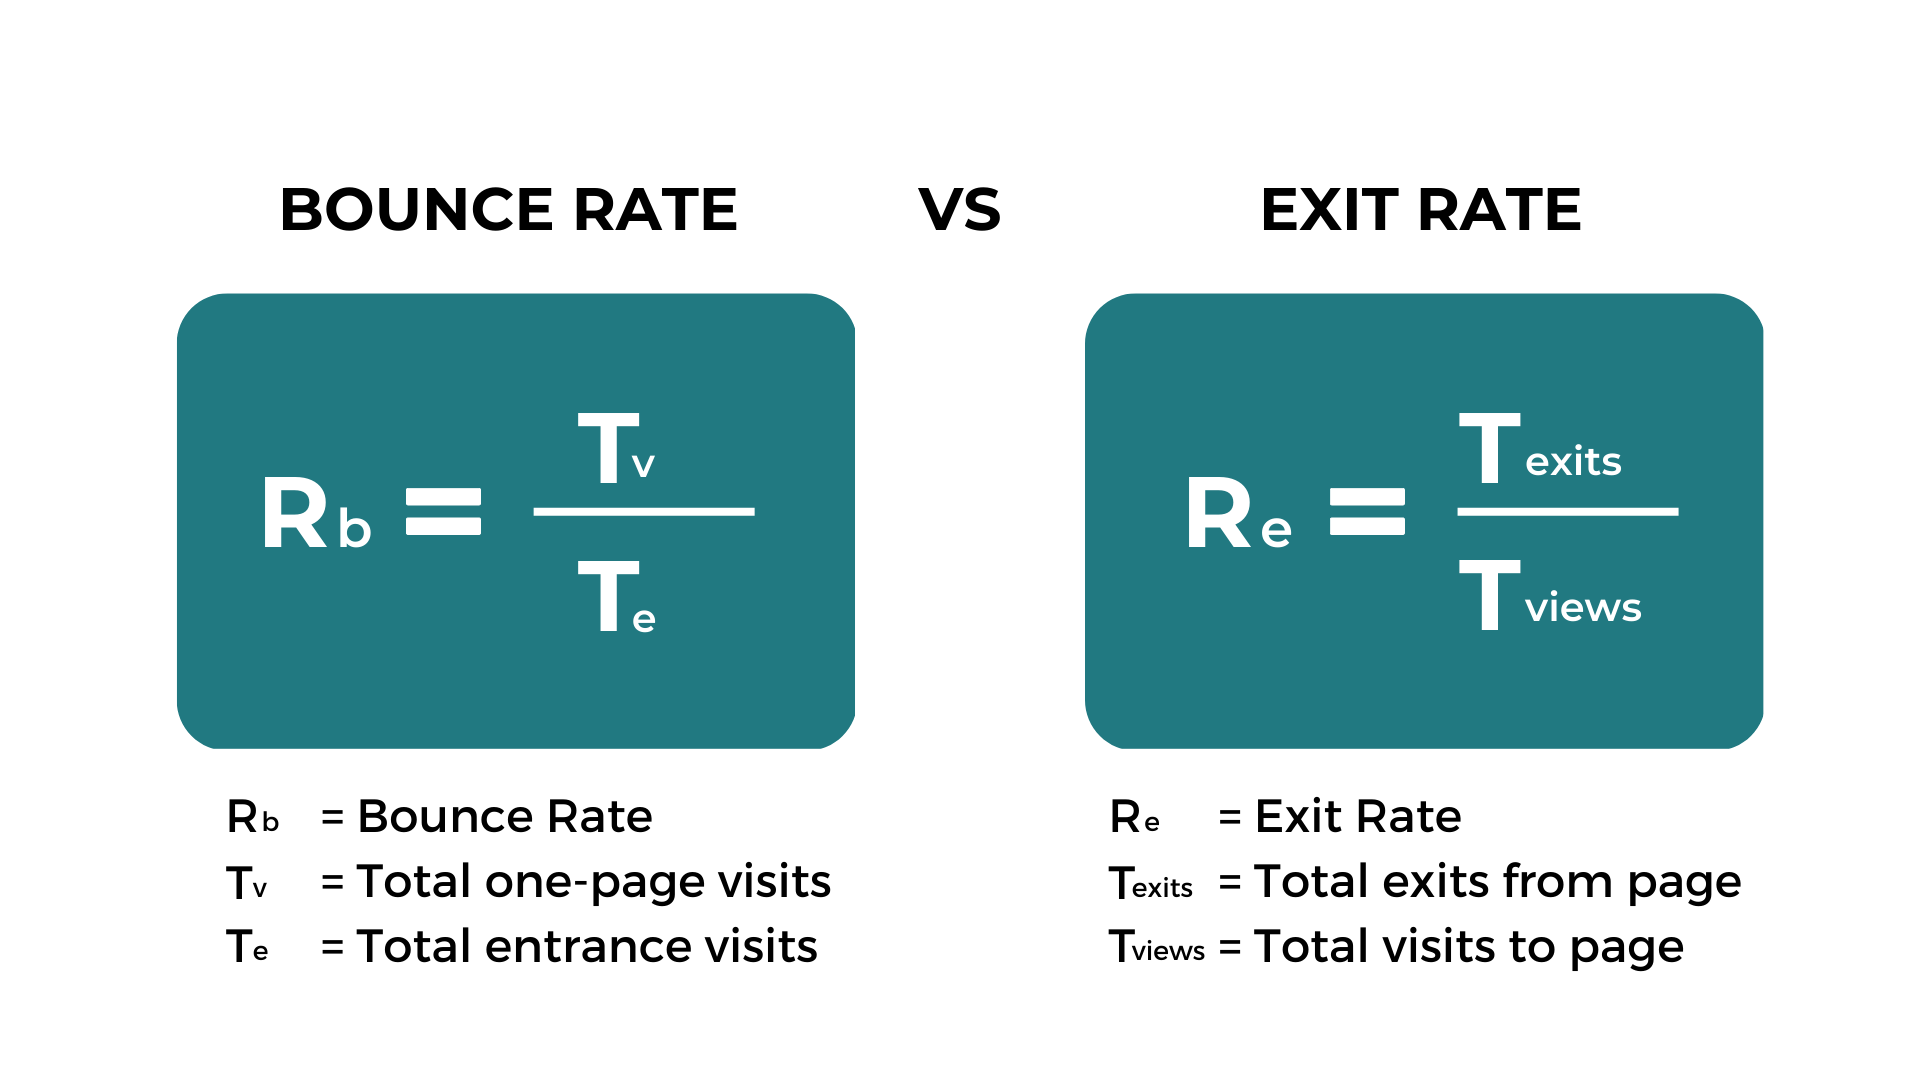
One more thing. Don’t confuse bounce rate with an exit rate. These metrics might seem the same, but they aren’t:
- Bounce rate essentially means that people land on one page and exit that same page without interacting with your site in any way.
- But the exit rate simply shows how often users leave from a specific page. For example, a person could browse a couple of your pages and then exit your pricing page. Then your pricing page is the “last stop,” and that contributes to its exit rate.
Source: Abtasty
How to improve:
There could be way too many reasons for a high bounce rate. So, you have to test this one:
- Obviously, take your time to work on the page speed. These days, people don’t tolerate even a two-second delay.
- Don’t lure users in with fake headlines. If your meta title promises “10 Free Templates,” make sure they don’t land on a sales pitch.
- Add links to related articles or products so users can interact with multiple pages. For example, if someone’s reading about SEO basics, guide them toward “Advanced SEO Strategies” next.
- Make sure visitors know what to do next. Click, download, buy. A confused visitor is one who bounces.
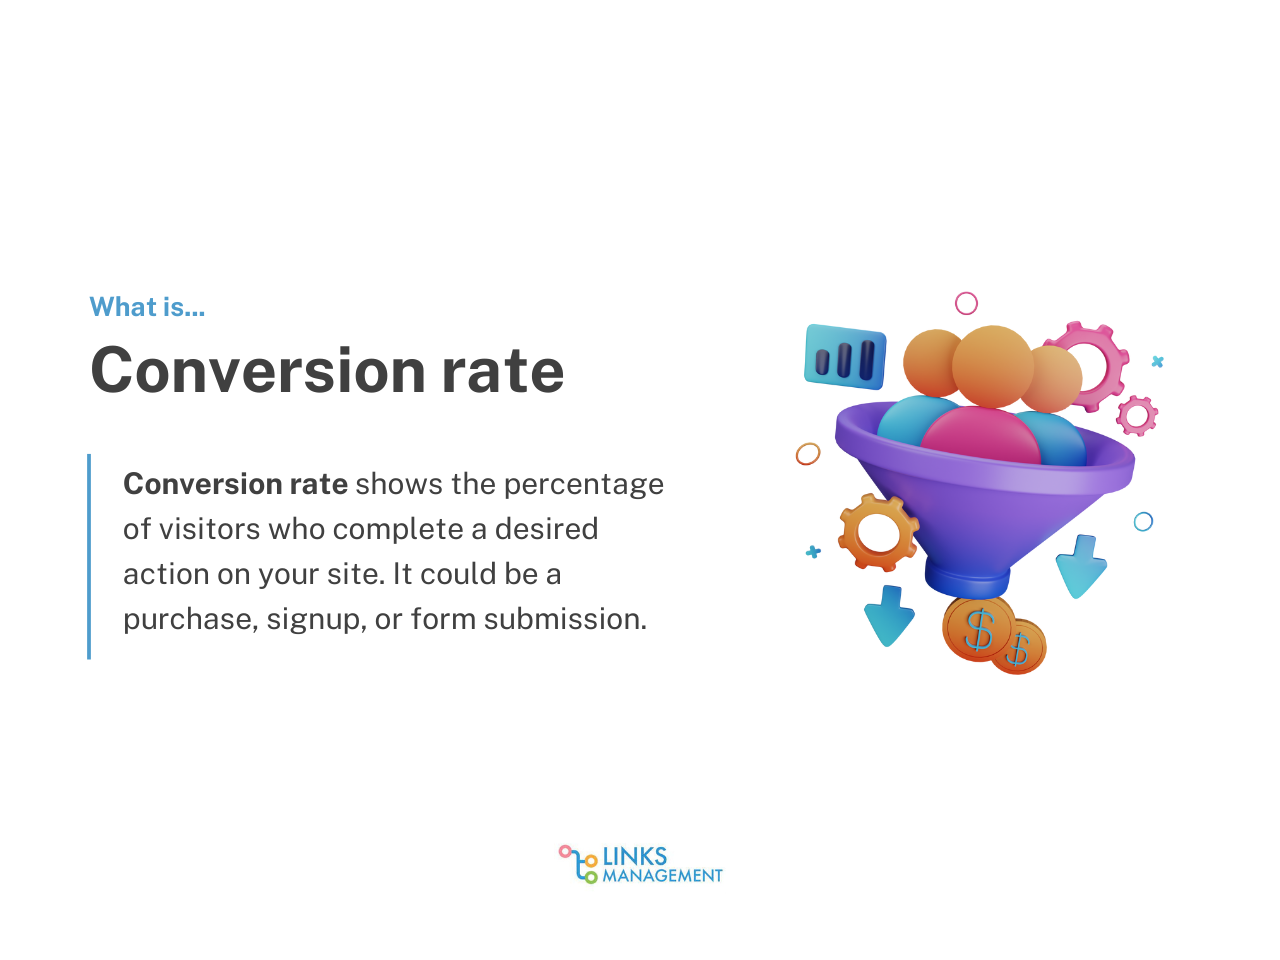
#5 Conversion rate
If you had to pick only one KPI to obsess over, conversion rate might be it.
Why? Because this is the “desired action” metric. It tells you how many of your visitors actually do the thing you want them to do. Buy, subscribe, click, or _____? So, yes, conversion isn’t always a sale.
It’s like hosting a party: 200 people may stop by, right? But how many actually stay for dinner and not just grab a quick drink and leave?
Let’s look at a realistic example to understand this better:
Say you run an e-commerce site with 10,000 visits a month. If, out of those, 300 people make a purchase, then your conversion rate is:
CR = (Conversions ÷ Total Visitors) × 100 = (300 ÷ 10,000) × 100 = 3%.
That 3% number tells you more than raw traffic ever could.
- High web traffic with a low conversion rate means your marketing initiatives are working to attract people, but… But. Something’s off in the way users interact with your site. Maybe the product pages aren’t convincing enough, or the checkout is too clunky.
- On the other hand, even modest traffic with a strong conversion rate can bring in a healthy number of customers.
You can find your conversion rates pretty much everywhere, from Google Analytics and HubSpot to Shopify Analytics and Hotjar.
How to improve:
- If your conversion rates could be better, consider looking into the following:
- Simplify your forms (fewer fields = more completions).
- Use trust signals, like testimonials, case studies, security badges, etc.
- Improve page speed (a slow checkout kills conversions very fast!).
- Add urgency (“Offer ends today” or something more unique but immediately understandable).
- Run A/B tests on headlines, CTAs, and layouts. Classic, but so effective.
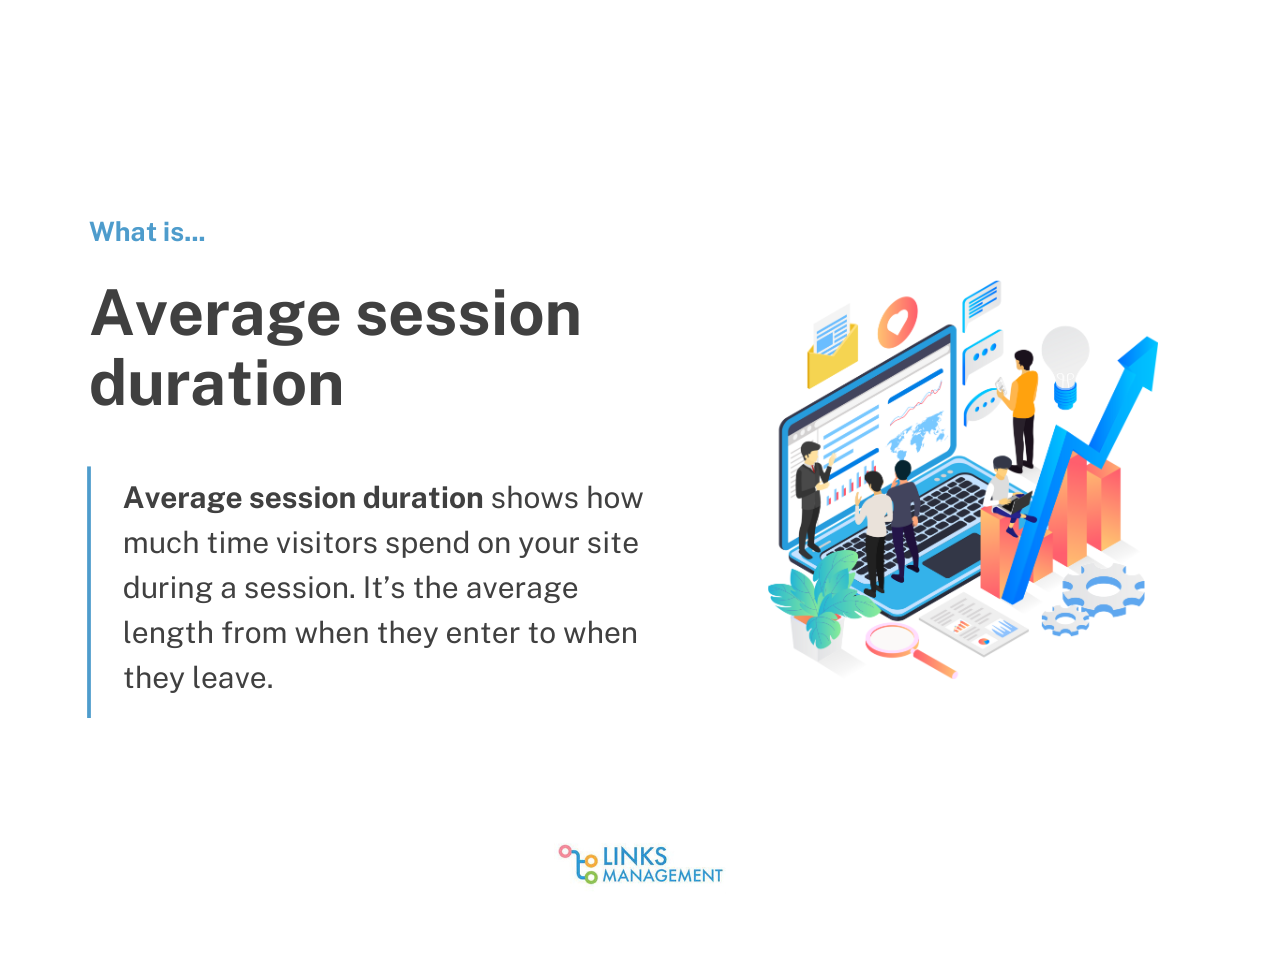
#6 Average session duration
Average session duration is one of those sneaky KPIs that doesn’t sound exciting. At all! But like many boring things in life (eating vegetables, filing taxes, sitting through bad sales pitches), it reveals something super important.
It shows how long people actually hang out on your site.
You might think it’s about traffic. Nuh-uh. It’s about user engagement. If there’s nothing remotely engaging on your site, then…wait for “uh-oh”.
Let’s check an example:
For instance, your blog’s average session duration is 3 minutes. If your new 2,000-word guide gets people to stay and read for 7 minutes, you’ve clearly hit user expectations. Bingo!
Source: Sitechecker
Timeless question again: Why does it matter?
While average session duration isn’t a direct ranking factor, search engines still value engagement. Longer sessions often mean that your website content matches search intent.
And satisfied readers are much more likely to share your content, check out more pages, and come back to your site. All of these can both directly and indirectly influence your rankings in search engine results.
Average session duration shows how long visitors stay on your site. So, for marketers, it’s a key metric to see if their content strategy is keeping people engaged.
More time spent on your page = more engaged leads = higher chance of conversions.
- If your goal is brand awareness, longer session durations often show that people like what you’re saying. So, soon this might lead to trust and maybe even loyalty.
- And if your goal is lead generation, this metric might show whether people care enough about your offerings. If they spend lots of time but don’t convert, check whether you attract the proper audience and whether your direct copy is convincing enough.
Tip: Look at session duration across a specific period of time and compare it between traffic sources. For example:
- Organic search might bring longer sessions (“researchers” who are actually reading your content).
- Paid ads might bring shorter ones (click-and-bounce window shoppers).
How to improve:
If you see that people don’t spend a lot of time on your website, you might want to do the following:
- Create a focus group to check your content. Take people who don’t know anything about your product/service. And ask them whether they understand what your offering is, whether they would buy from you, and what they’d improve.
- Add internal links to encourage users to go through multiple pages.
- Embed videos, infographics, or interactive tools.
- Format long articles with headings, bullet points, and visuals (walls of text = fast exits).
- Use storytelling and forget about corporate jargon. People want to read vivid stories, not another boring essay.
- If you attract the wrong crowd through misleading paid ads or influencer marketing, they’ll leave quickly. So, align your traffic sources with website content. This way, people will get exactly what they expect.
#7 Returning vs. new users
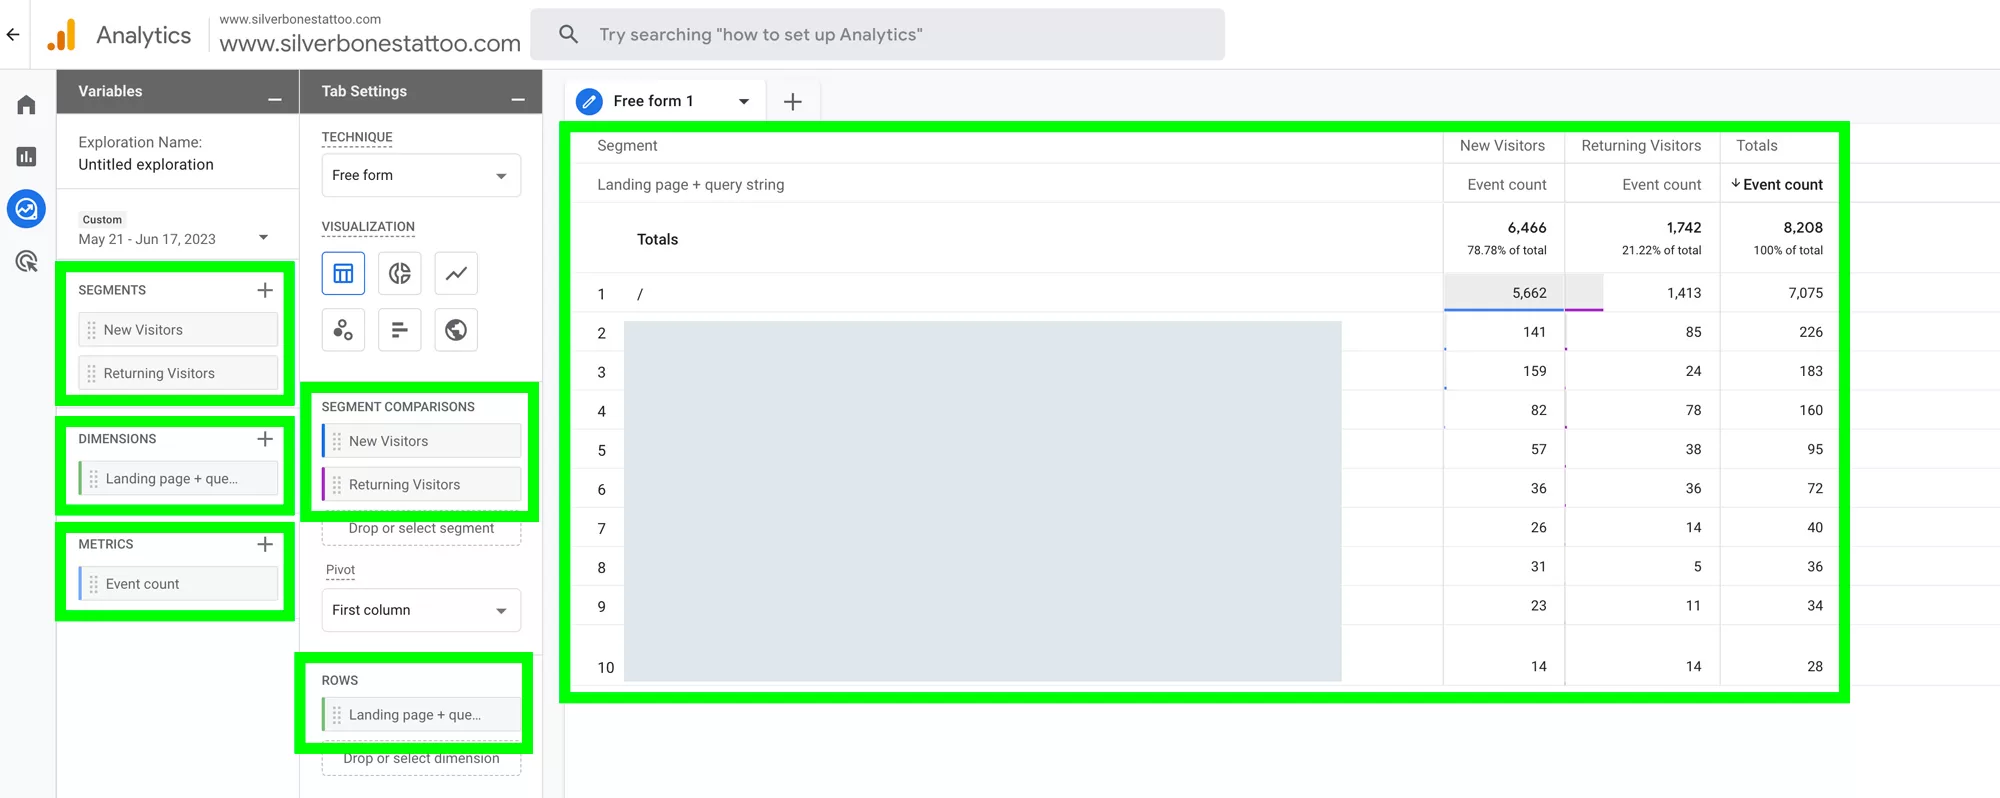
When you look at your analytics dashboard, you’ll see two important tribes of site visitors. Those who are seeing your web page for the first time, and those who’ve been there before. In the analytics language, they’re called new users (visitors) and returning users (visitors).
Source: Sitechecker
It may sound simple, but this metric is one of the most revealing ones. Why? Because it shows the health of your marketing strategy on two fronts:
- Reach. Are you expanding your funnel and attracting fresh eyes?
- Retention. Are you giving people a reason to come back, spend more average time on page, and eventually convert?
That’s why you need both. New visitors expand your reach. Returning visitors prove your content is engaging enough for repeat interactions.
Here is an easy example:
- If you have 70% new visitors, 30% returning, your reach is growing.
- If you get 30% new, 70% returning users, you’ve built loyalty. But maybe your awareness campaigns need more attention.
Ignore this balance, and you risk either becoming invisible to new audiences or losing the loyalty of the ones you’ve already worked so hard to capture.
Source: RW Digital
How to improve:
If you see that your ratio between new and returning users doesn’t work for your goals, try the following.
To increase the number of returning visitors:
- Encourage new users to subscribe to your newsletter, community, product, etc., so they become return visitors.
- Use remarketing campaigns to bring past visitors back.
- Refresh content regularly so people have a reason to return. And make sure that your content is truly helpful.
To increase the number of new visitors:
- Work on SEO to attract new organic traffic (try to target different keywords).
- Consider paid ads to get fresh leads.
- Think about working on your PR, social media presence, influencer marketing, etc.
- Try referral marketing and collaborations with your business partners (if any).
#8 Keyword rankings
Rankings are one of the first things people care about when it comes to content and SEO. Everyone knows how your website’s success depends on smartly used search queries.
Keyword rankings tell you how high up your pages appear on Google for the phrases your target audienceis searching for. Tracking website KPIs without this metric is kind of useless (especially in terms of SEO).
And if you’re deciding where to direct your marketing efforts, this could be one of the things to consider.
To measure it, you need one of the well-known (and credible) tools, like Ahrefs, Semrush, Google Search Console (free), etc.
If you’re just starting your journey, you can even try some free options online, like this Keyword Rank Checker by Ahrefs.
Source: Ahrefs
Of course, this isn’t a one-time task. If you want to rank well and stay in your high positions, you have to track this continuously. But again, you can do this easily with any SEO software.
Source: Semrush
How to improve:
Improving your keyword rankings is a big task. And if you’re serious about it, you have to do all types of SEO optimization (on-page, off-page, and technical). This is the only way to show great results.
Still, to summarize it, you can do the following.
- Optimize on-page SEO (title tags, meta descriptions, content structure, etc.).
- Publish fresh, long-form content targeting the correct user intent.
- Earn backlinks from relevant sites to improve your DA/DR. You can also buy backlinks to simplify this task.
- Improve site speed and mobile friendliness (aka Core Web Vitals).
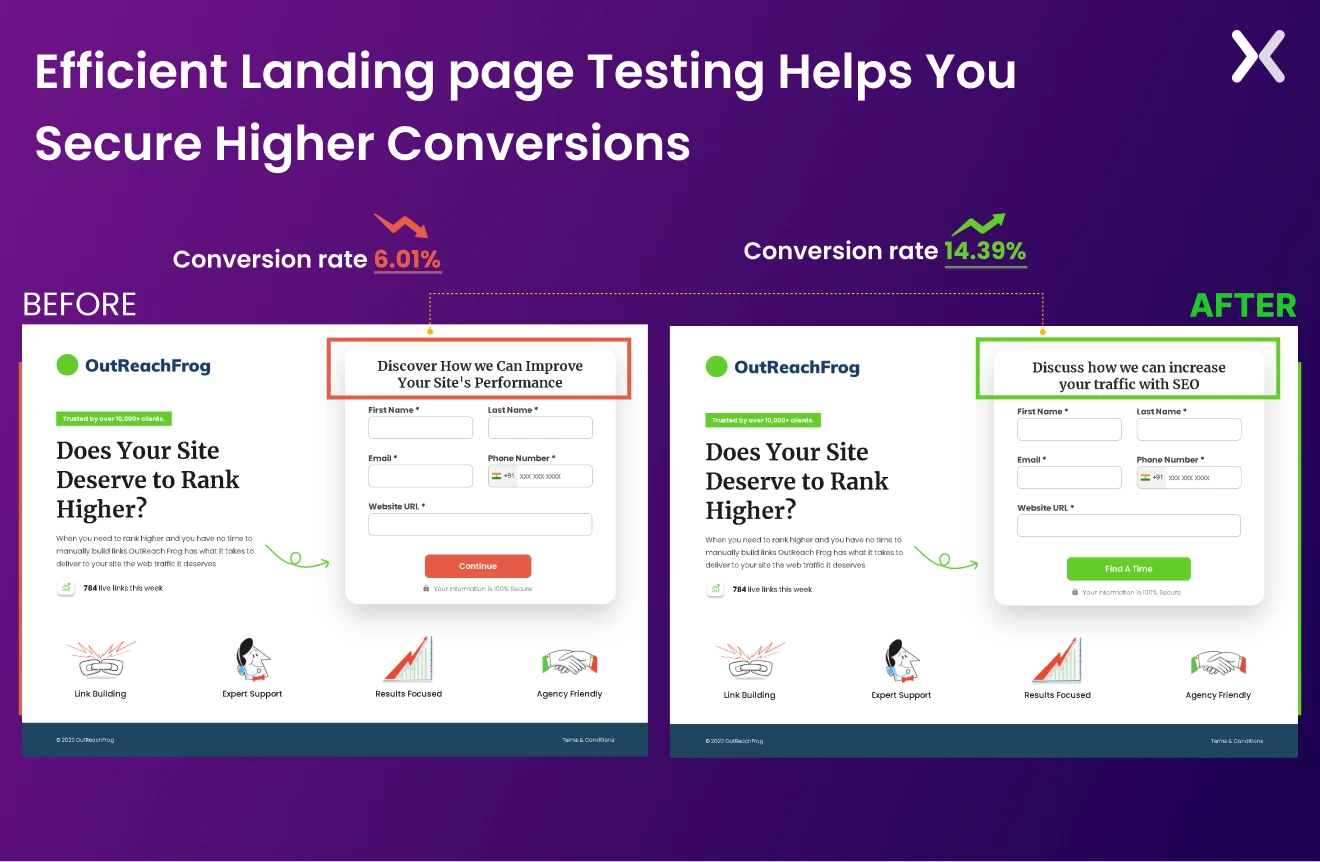
#9 Best-performing landing pages
Best-performing landing pages is an extensive KPI that shows you which landing pages on your website drive the most valuable results. As easy as that.
This is one of the most down-to-earth marketing KPIs due to its directness.
It gives you a good look at where visitors are first arriving and which pages are actually moving them closer to your business objectives. In other words, you need it to come up with informed decisions about your content strategy.
Tracking best-performing landing pages matters because it highlights what’s working.
- If one page consistently brings in high-quality leads or sign-ups, you know where to allocate more budget for promotion.
- Besides, it gives you a better idea of the tactics that work well.
- It also identifies your weak points. Pages with high traffic but low conversions may need stronger messaging and better calls to action. Sometimes, they might need design or performance improvements.
- Finally, it connects directly to ROI. Landing pages are often tied to paid ads or email funnels. So, their performance directly affects your marketing expenses.
Now, let’s see how you could analyze this in practice. Say you run a SaaS company with three key landing pages:
- Free trial sign-up page.
- Product features page.
- Industry-specific case study page.
And let’s assume your analytics show the following situation:
- The case study page brings in 20% more conversions than your trial page.
- The product features page has the highest average time spent, but the lowest conversions.
- The trial page gets tons of traffic from paid ads but has a sky-high bounce rate.
Case study page:
This clearly shows you that your audience loves case studies and real-life proof. So, you could use this page for paid ads and share it more on socials and other channels.
Product features page:
Besides, you could take some parts of those case studies and use them on your product features page to see if it helps conversions there.
Also, review how good your CTAs are on this page. Probably, people like your content if they stay long. But if they don’t convert, something is off.
Trial sign-up page:
And as for the free trial page, your ads work to attract people. But probably, they are attracting the wrong audience. So, make sure you check whether your promise in the ad corresponds to your landing page offer.
Plus, you could try adding some “warm-up” steps before the trial offer. This could be a free lead magnet, some parts of your case studies, maybe some video tutorials, etc.
Source: Apexure
How to improve:
To improve your landing page performance, you have to do lots of A/B testing. And these are some aspects that you could check:
- Make sure the headline and copy reflect what brought the user there (e.g., meta title, ad promise, or email subject line).
- Use concise headlines, clear value propositions, and strong calls to action.
- Minimize form fields, remove unnecessary links, and keep the focus on one desired action.
- Optimize for speed. Even the best content fails if the page loads slowly.
- Use data: A/B test CTAs, form placement, copy length, and design elements to see what improves conversions.
- Add trust signals. Testimonials, case studies, or client logos help reduce hesitation.
#10 Top exit pages
As we said before, every website has a story to tell. The homepage introduces your brand, the product pages build curiosity, and the blog posts educate. The checkout page, in a perfect world, closes the deal.
But… the world is far from being perfect. And it is normal that in the middle of “the story,” your site visitors close the book. That final page they touch before saying “I’m out” is your exit page.
The truth is, your top exit pages are always honest. Always. They show you exactly where your target audience is getting bored, frustrated, or unconvinced.
If you ignore them, you’re essentially ignoring the moment someone chose to “end a relationship” with your business (at least at that moment).
In other words:
- An exit page is the last web page someone views before leaving your site.
- A top exit page is any page where lots of visitors decide they’ve had enough and hit a little “X” in the corner.
Here is a simple example:
Let’s say a blog gets 5,000 visits a month. If 2,000 people read one particular article and then immediately exit, that post is your top exit page. Is that bad? Not always, not necessarily.
It depends on your marketing strategy. Maybe the post did its job, delivered value, and users left satisfied.
But what if your checkout page is the top exit page? Mmm…that’s bad.
That’s almost like shoppers abandoning their carts at the register because they saw a surprising $15 “processing fee.” This is clearly a problem.
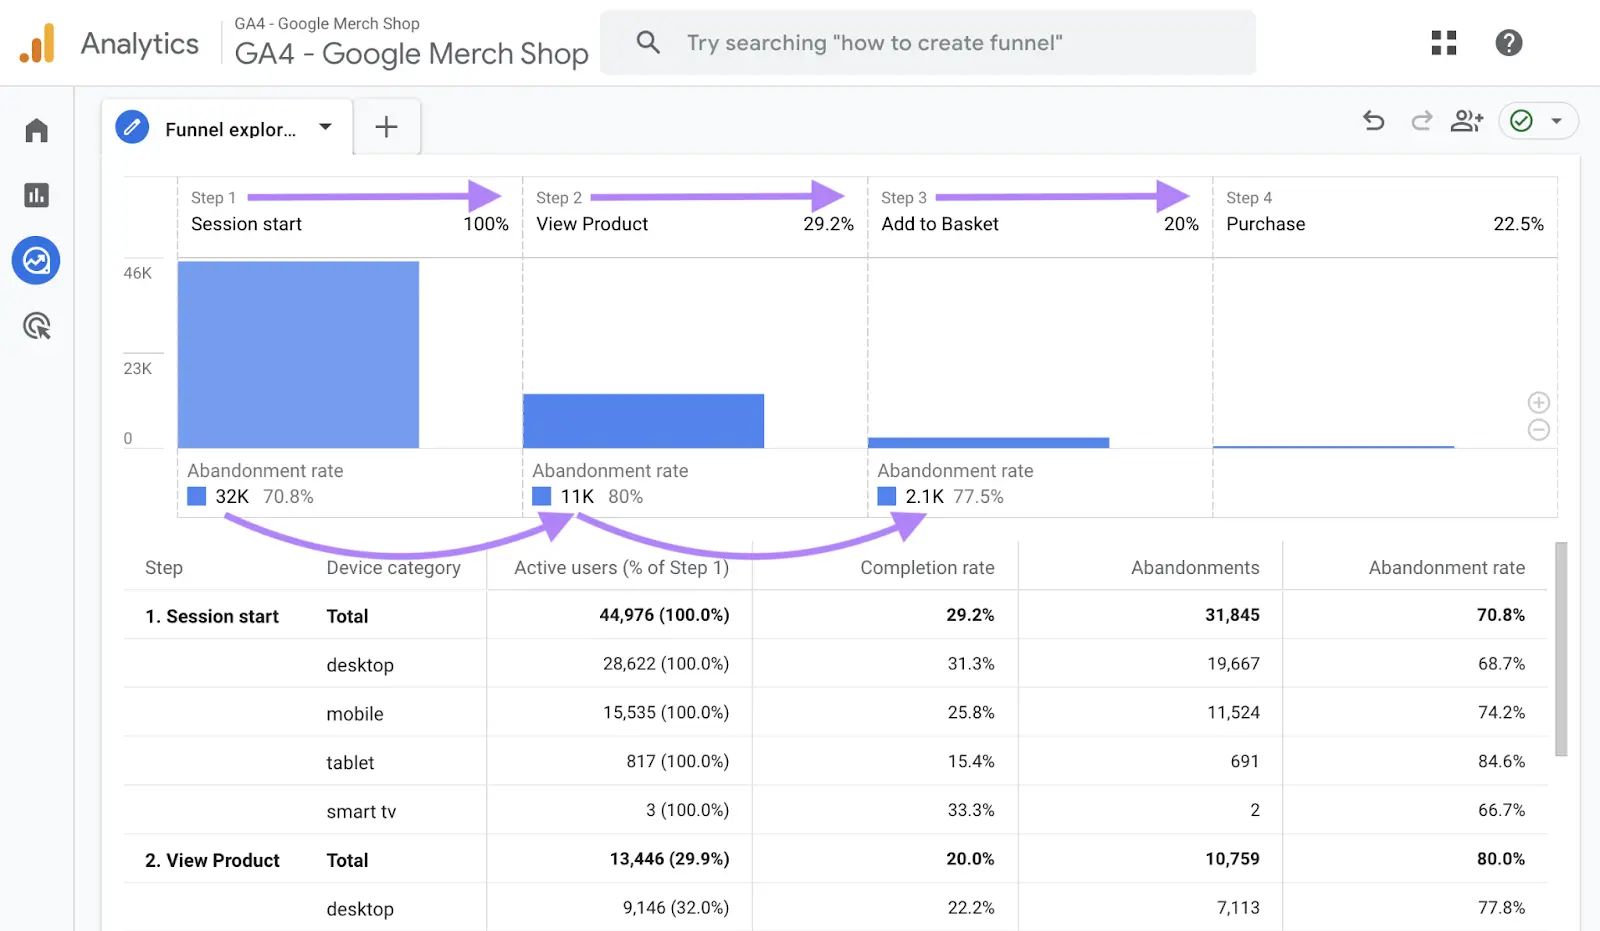
Source: Semrush
Why does this metric earn a spot among the most important website KPIs?
- It exposes conversion leaks.
- When exits pile up on contact pages or forms, it means friction. Maybe your form is too long. Maybe your page feels sketchy. Either way, people don’t trust you enough to hand over their info.
- If a huge share of exits comes from blog posts, maybe your marketing efforts aren’t tying that content back to offers, newsletters, or free trials.
- Knowing where people leave tells you how to redesign, reposition, or simplify your web pages so your target audience stays to explore different pages.
How to improve:
The improvement process here is quite straightforward:
- Audit the content. Is the page answering the question people came for? If not, they’ll leave. For blogs: add internal links to related posts. For product pages: polish descriptions, add reviews, and include pricing clarity.
- Sometimes, people exit not because of content, but because of poor UX. Work on that, if that’s the case. Run a poll to find out what makes people leave. Or again, create a focus group to test your issues.
- Make sure that each of your pages has internal links that can help your visitors explore something else they might be interested in.
#11 Website performance
You can have the most beautiful web page in the world. With clever copy, gorgeous design, and a free puppy GIF at the end. Cool.
But if it takes forever to load, nobody will really enjoy your refined aesthetic.
People will leave. 100%.
That’s the cruel reality of website performance. It doesn’t matter how brilliant your marketing strategy is, or how much money you’ve poured into your marketing efforts. If your site doesn’t load, well…bye.
In KPI terms, website performance is how quickly and smoothly your site delivers content to users. It covers:
- Page speed: How long it takes for your web page to load.
- Core Web Vitals: Google’s set of metrics for user experience: Largest Contentful Paint, Interaction to Next Paint, and Cumulative Layout Shift.
- Uptime and reliability: If your site crashes regularly, no amount of marketing can save you.
- Mobile optimization: With most traffic coming from mobile now, a site that only looks good on desktop is dead on arrival.
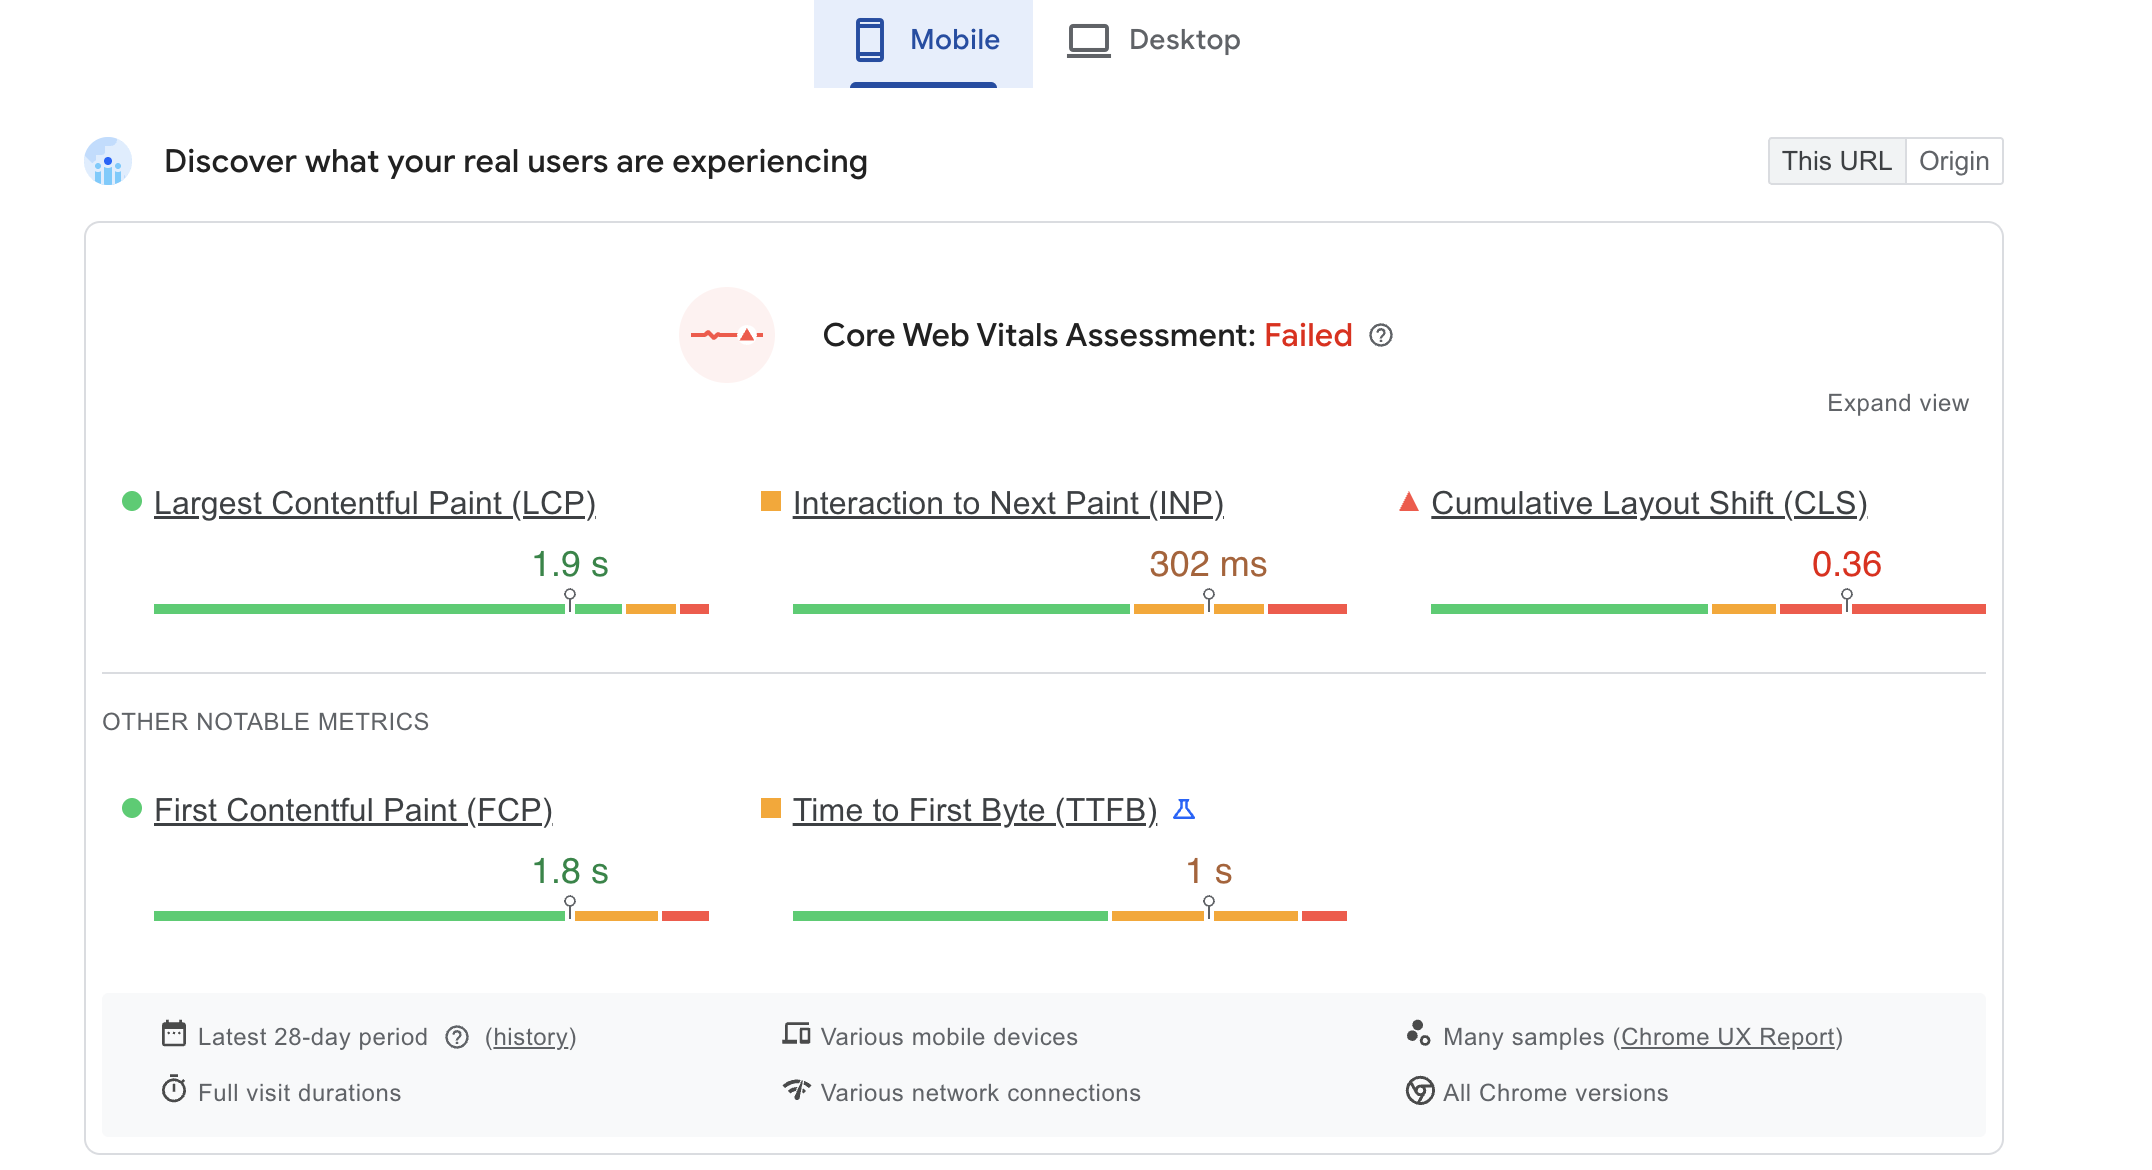
Source: PageSpeed Insights
It’s clear why these KPIs matter, right? But here are some real facts.
First of all, Google openly states that page speed and Core Web Vitals are ranking factors. Better performance basically means better visibility in search engine results, which leads to more traffic.
Amazon once found that every additional 100ms of load time cost them 1% in sales. And it was a long time ago, now, loading speed is even more important.
How to improve:
If you want to improve your website performance, start by running a free analysis through PageSpeed Insights. From there, you can simply tweak what the tool suggests. Typically, it comes down to:
- Cleaning up your code by removing unnecessary elements.
- Optimizing your images and other visuals.
- Making sure your hosting and infrastructure are on point.
- Working on your mobile-friendliness by ensuring that you have a responsive design.
- Monitoring your website performance regularly. And monitoring it again.
Conclusion
At the start of this guide, we asked a simple question: What does it mean for a website to work?
The answer, as you’ve seen it, lies in keeping an eye on the top website KPIs mentioned above. Essentially, they are windows into how your site visitors experience and interact with your business.
One last insight: don’t chase numbers or vanity metrics. Instead, make informed decisions based on those numbers. And improve your user journeys as a result.
FAQ
What is a KPI for a website?
A KPI (or Key Performance Indicator) is a measurable metric that shows how your website is achieving its business objectives. It can be anything from traffic and conversions to customer acquisition cost and best-performing landing pages.
What are some good KPI examples?
Some of the best website KPIs to track include:
- Traffic sources (organic search, referral, paid, etc.),
- Conversion rate (desired action completions),
- Page views and unique visitors,
- Returning vs. new visitors,
- Bounce rate,
- Keyword rankings,
- Website performance (Core Web Vitals).
How many pages should I track to measure my website performance?
It depends on your website. At minimum, track your homepage, top landing pages, and any particular pages tied to conversions (pricing, checkout, signup, etc.). Still, start small and don’t try to monitor all at once.
How do I align KPIs with my business objectives?
Start with the big picture. Are you trying to acquire more customers? Reduce sales expenses? Improve brand awareness? Then map your website metrics (traffic sources, conversion rate, keyword rankings, etc.) to those goals.
And choose only those that make sense for your particular objectives.
Related Posts

Published Aug 26, 2025

Last updated Mar 7, 2024 | Published Nov 28, 2023

Published May 27, 2025

Published Dec 9, 2025

Published Jan 6, 2026

Published Jan 28, 2026
Enter URL & See What We Can Do Submit the form to get a detailed report, based on the comprehensive seo analysis.